Statistics report
- Log in to post comments
- Tiếng Việt
- 繁體中文
Route history
1. Purpose
- Supports users to view detailed vehicle journeys and simulate vehicle movement every 30 seconds.
2. Implementation conditions
- The user is authorized to use the Route history function in the authorization section.
3. Implementation instructions
- Go to menu Statistics report/Route history
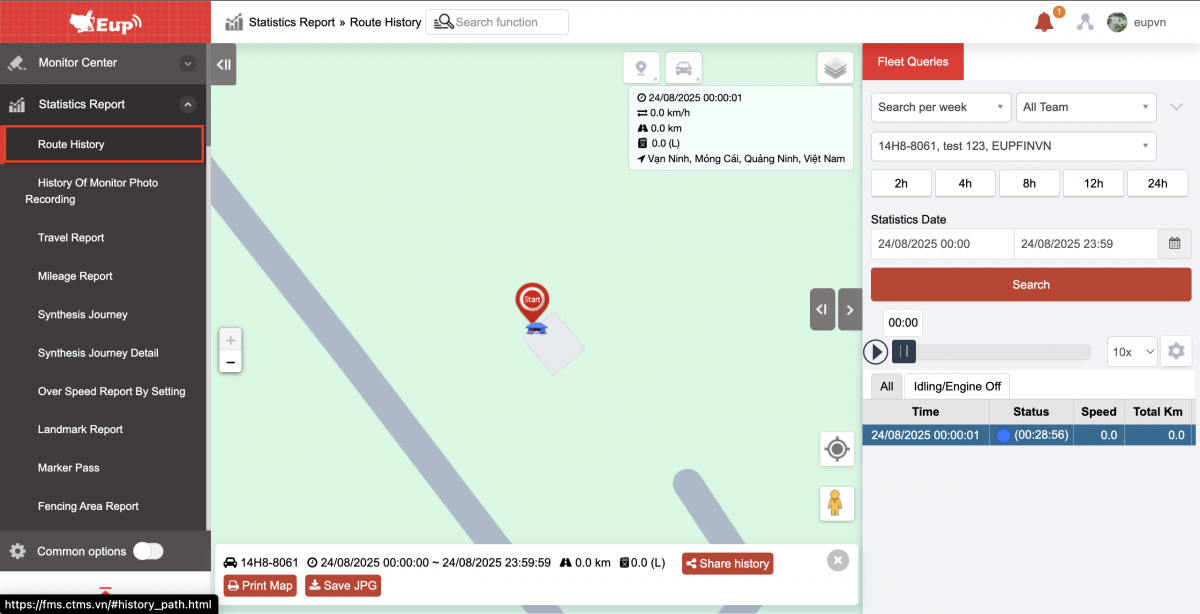
- The function display screen consists of 2 parts:
+ The Map section describes the vehicle's journey on the map;
+ The Fleet Queries section allows users to search and view the journey of each vehicle in the fleet within a certain period of time.
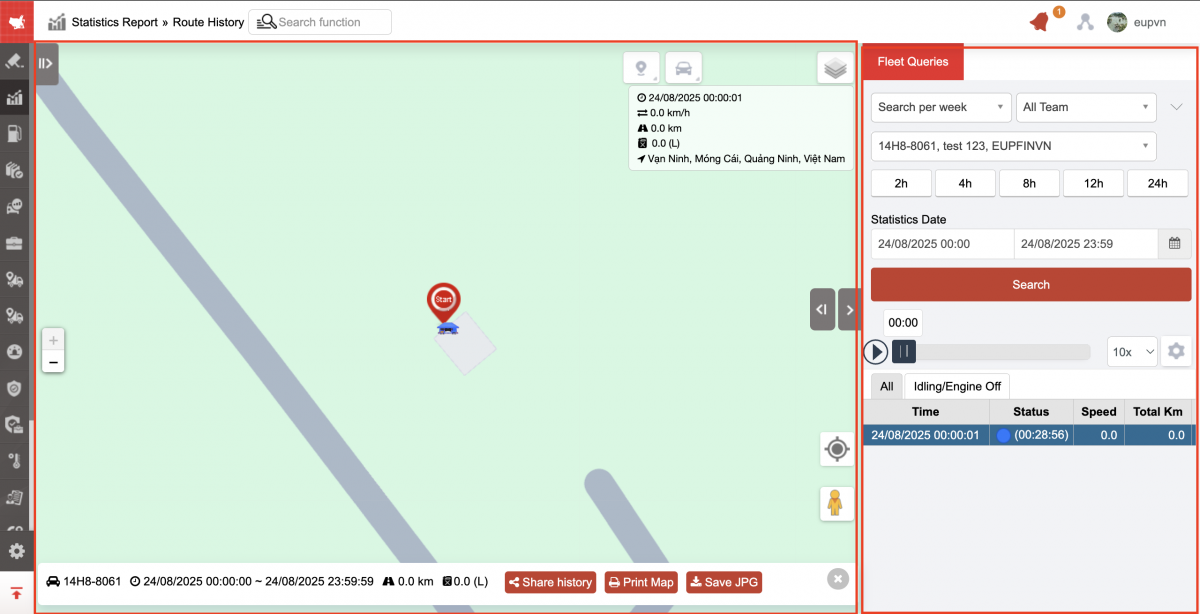
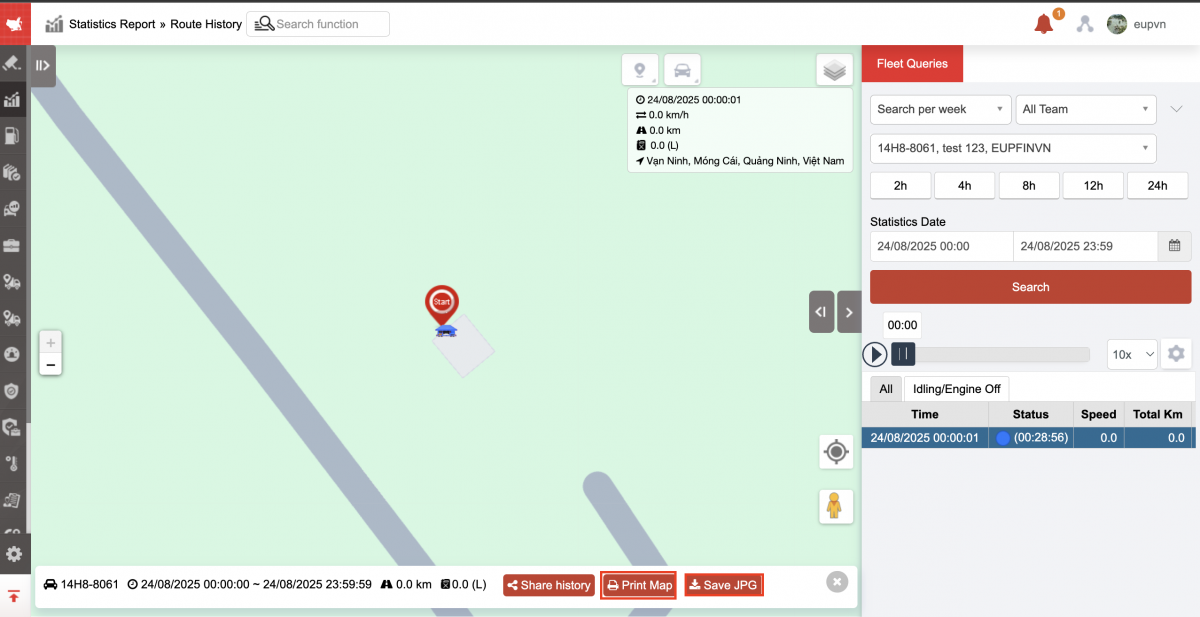
+ Map Section:
-
On the map, the vehicle status is displayed according to the color of the vehicle at each time. This section describes the vehicle's journey on the map. Users can select the play icon
 in the playback speed section to see the vehicle's movement simulation.
 -
Users can click the icon
 to view vehicle information on the map.
 -
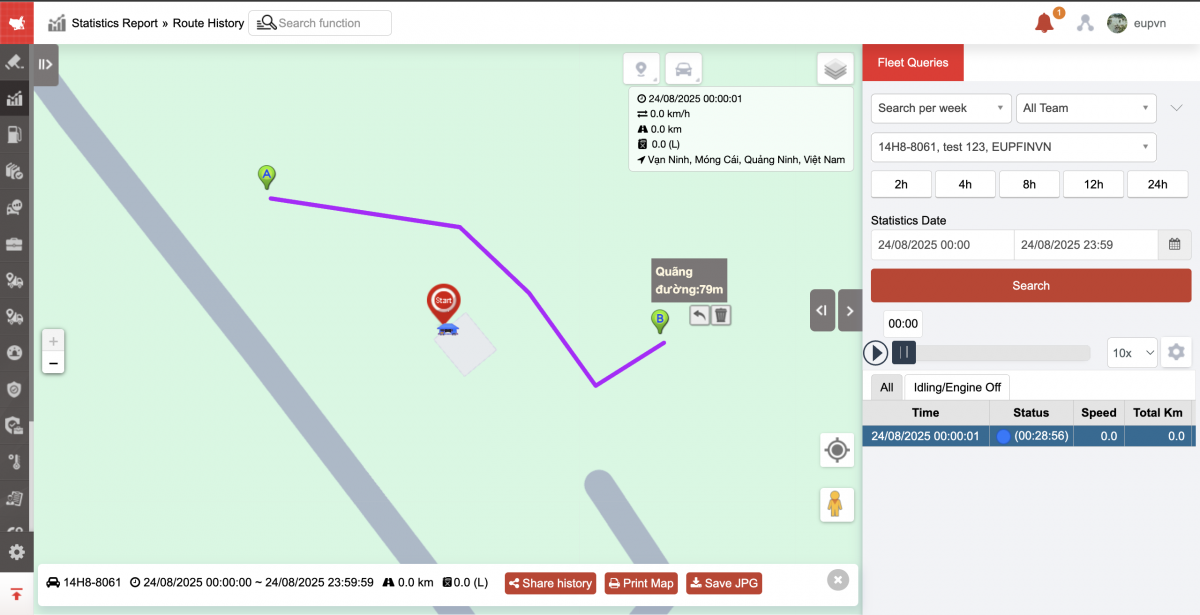
The map supports measuring distances between points on the route the vehicle has taken. To measure the distance between points, the user does the following:
-
Step 1: Select the icon

-
Step 2: Select the icon

-
Step 3: Left-click to select each point on the map to measure the distance
-
-
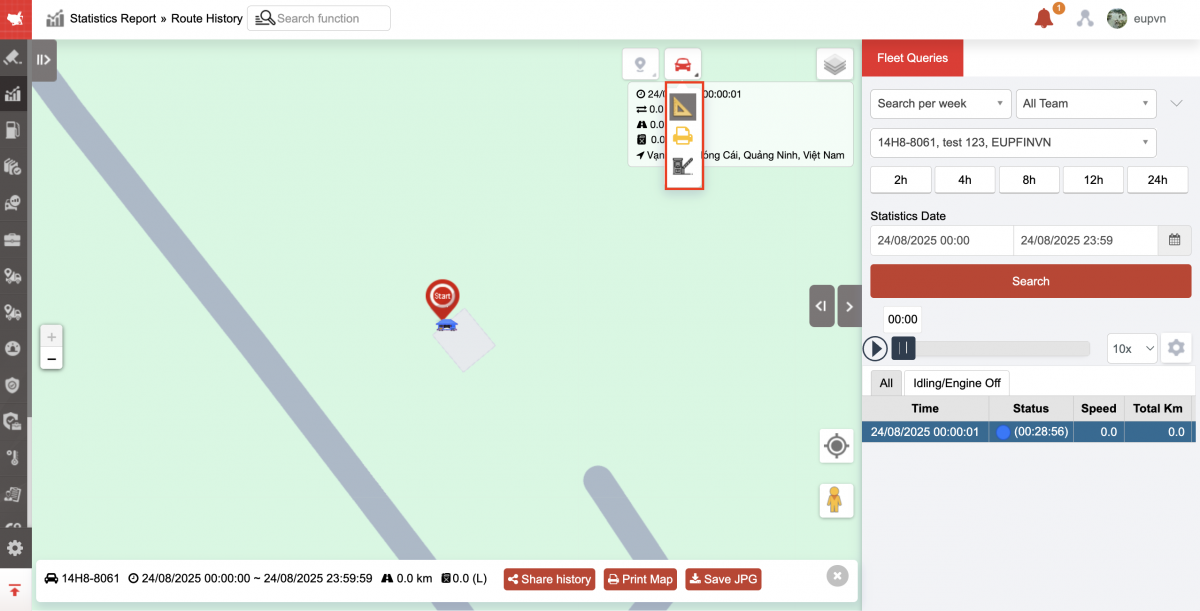
Select the icon
then select Print map: Print/ Save as image -
Select the icon
then select Show stations on map in trip history
-
Share history: Copy link and send to customer
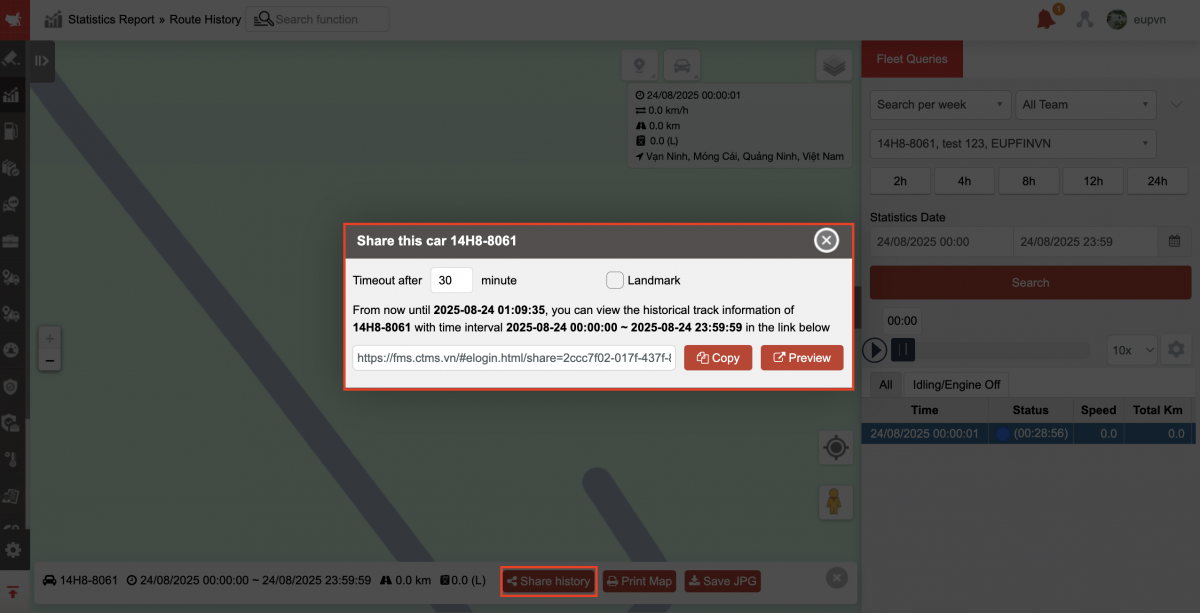
-
Print map
-
Save as JPG
-
Click the icon below to select map type: default map, open street map, satellite map

+ Fleet Queries section includes information:
-
All team: User selects icon
 to change fleet
 -
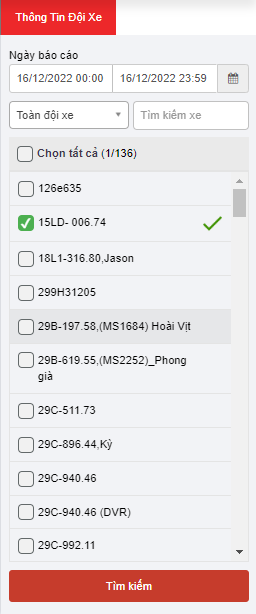
Select an option (Plate number): Select the icon
to select the vehicle whose travel history you want to view. -
From: Select the first hour, minute, day you want to search
-
To: Select the last hour, minute, day you want to search
-
Click Search to display detailed trip results
-
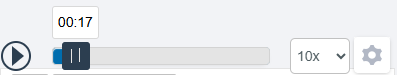
Vehicle movement simulation: User can select the play icon
 to view the vehicle movement simulation on the map. The system allows user to adjust the speed of vehicle movement on the chart.
-
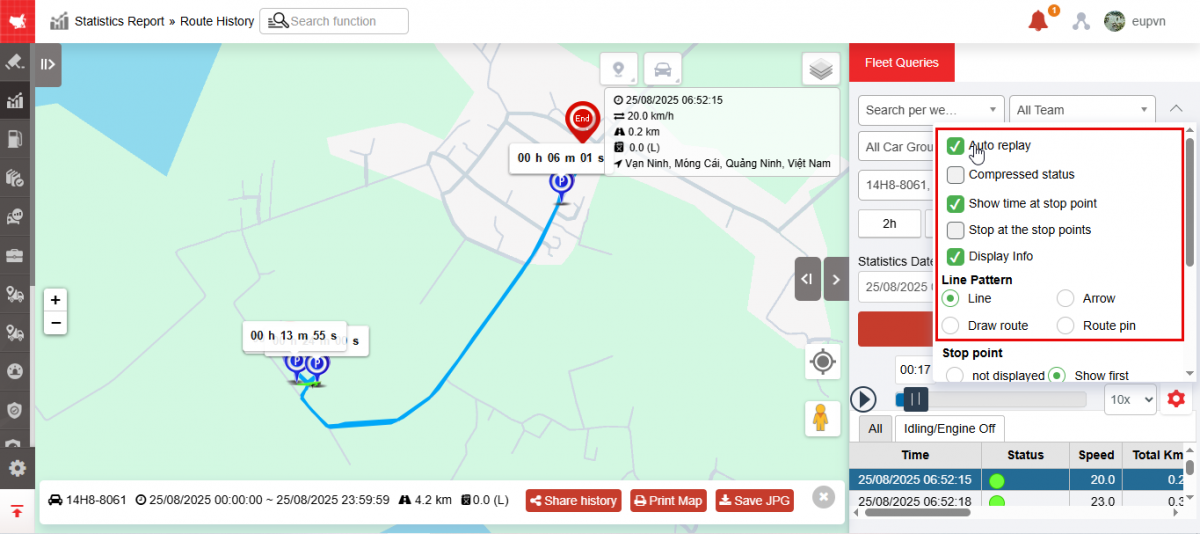
Auto replay: Select the checkbox to automatically playback the vehicle's travel path.
-
Compressed status: Select the checkbox to display detailed trip history by vehicle status
-
Show time at stop point
-
Stop at the stop points
-
Display Info: Enable/disable vehicle information popup in the upper right corner of the map and also when printing/downloading map images
-
Line Pattern: There are two options to draw the vehicle's path in odd lines, in arrows, draw a route or pin the route
-
Draw route: The route will be drawn again as the route is sent.
-
Route Pin: Route Time Pin
-
-
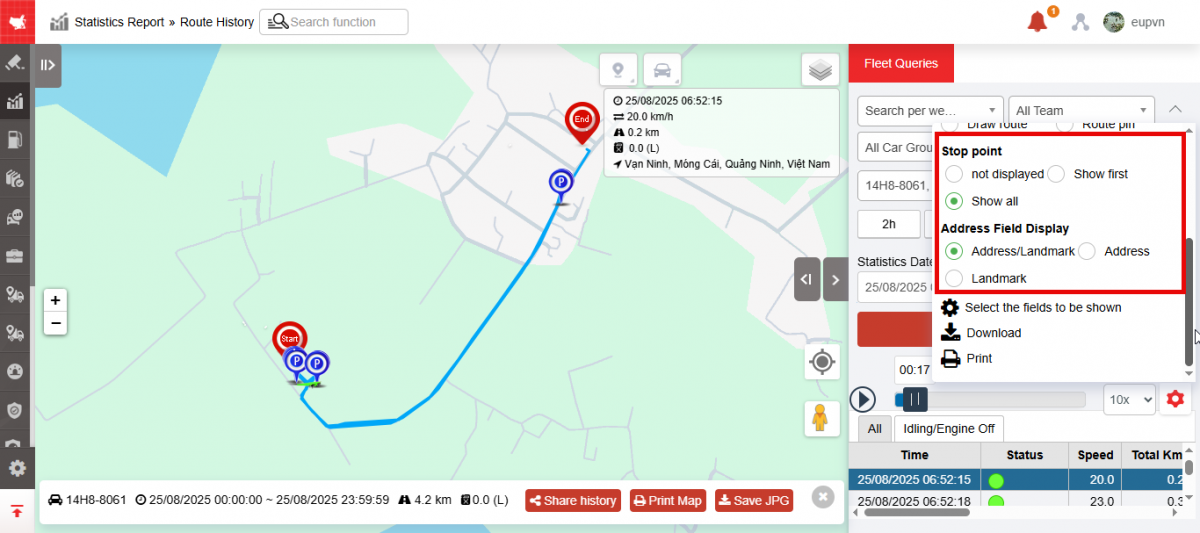
Stop point:
-
Not displayed: No parking stop shown
-
Starting point: If 2 stops are close together, only the first point on the route is displayed
-
All: Shows all stops on the route drawing
-
-
Show address field:
-
Address / Landmark
-
Address
-
-
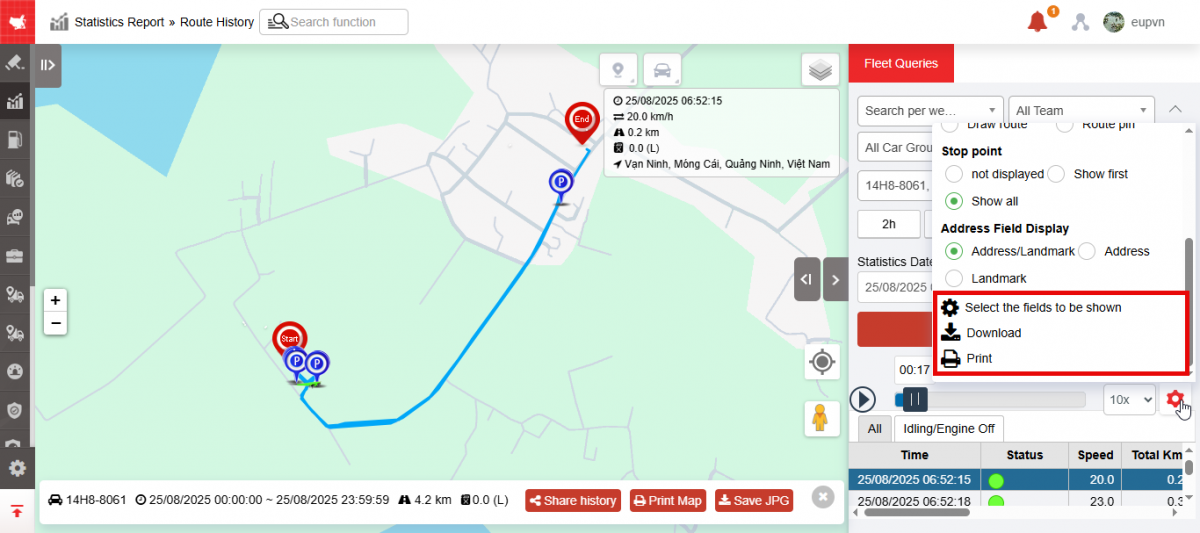
Select fields to display: Customize display columns
-
Download: Excel format
-
Print
-
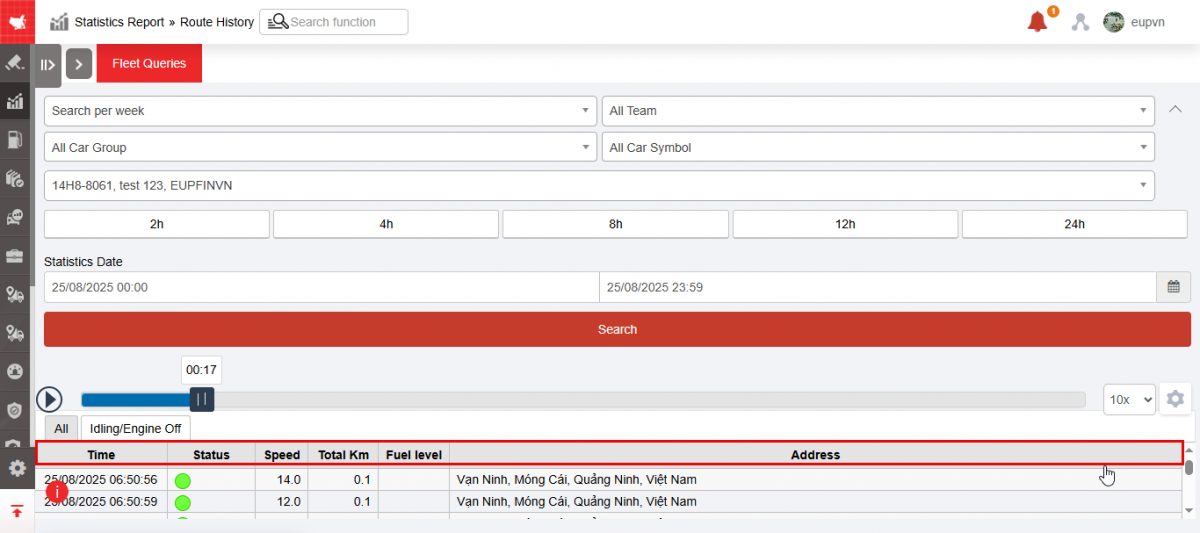
Travel information:
-
Time: Updated every 30 seconds
-
Status: Status of the vehicle
-
Speed: Average speed of the car in 30s
-
Total Km
-
Fuel level
-
Address: The address of the vehicle's destination at the time of updating the data to the system
-
- Log in to post comments
- Tiếng Việt
- 繁體中文
History of Monitor photo recording
1. Purpose
- Support users to view images during the vehicle's journey (3 minutes/image when the vehicle is moving)
2. Implementation conditions
- The user is authorized to use the History of Monitor photo recording function in the authorization section.
3. Implementation instructions
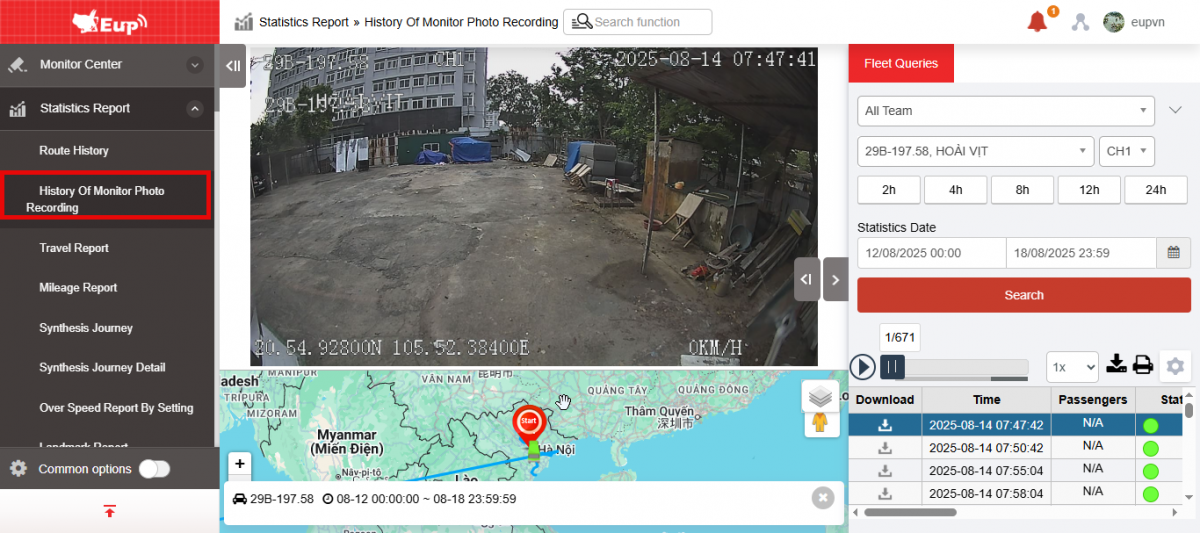
- Go to menu Statistics report/History of Monitor photo recording
- The function display screen consists of 2 parts:
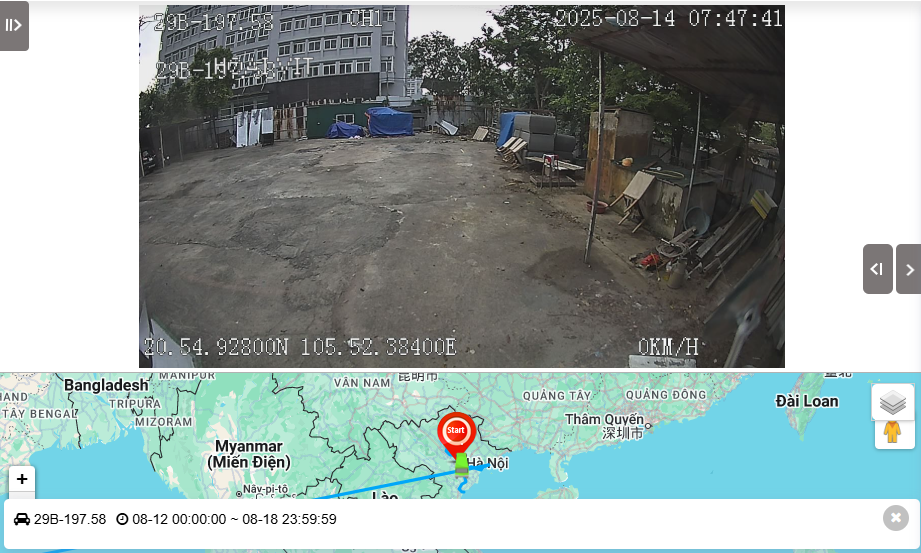
+ Map and Image section: describes the vehicle's journey on the map and image at the selected time;
+ The Fleet Queries section allows users to search and view the journey of each vehicle in the fleet within a certain period of time.
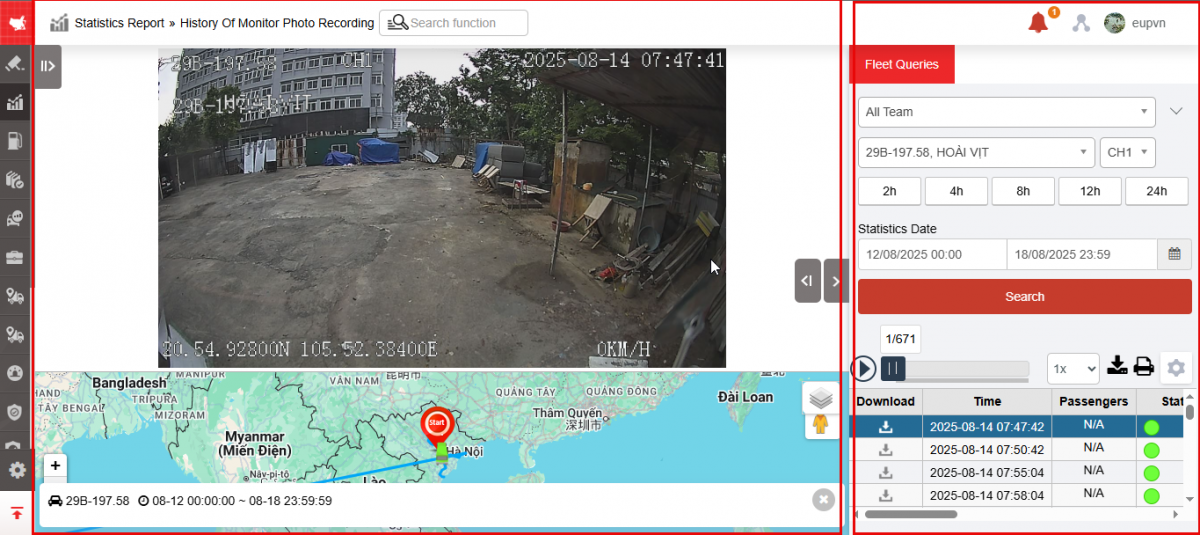
+ The Map and Image section displays images and descriptions of the vehicle's journey on the map: Image update time, plate number, speed, driver's name, time to view recording history
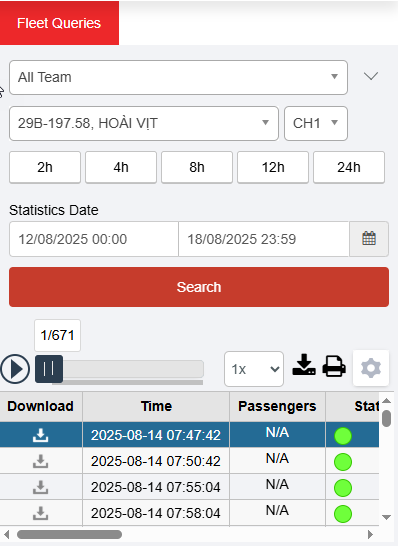
+ Fleet Queries section allows users to search and view images and journeys of each vehicle by fleet/by vehicle/by camera within a certain period of time.
-
All team: Default is All fleet. Select icon
 to select fleet
 -
Select the icon
to select the camera to view -
Quickly select a search period
-
Select report date
-
From: Select the first day you want to check fuel costs
-
To: Select the last day you want to check fuel costs
-
-
Click Search to display the recording monitoring history
-
Select icon
 to download itinerary
 -
Select icon
 to print
 -
Select icon
 to download image
-
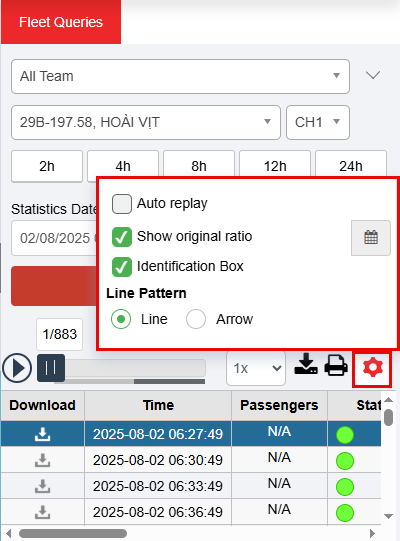
Click the icon
 to select settings
-
Auto Playback
-
Identification Box
-
Show original frame: Identify the number of passengers in the vehicle
-
Line pattern: Line/Arrow
-
- Log in to post comments
- Tiếng Việt
- 繁體中文
Travel report
1. Purpose
- Allows users to track vehicle journeys by week, day, and hour. From there, they can evaluate whether the vehicle is running on the correct route or not.
2. Implementation conditions
- Users are authorized Travel report in the Authorization function on the system.
3. Implementation instructions
- Go to menu Statistics report/Travel report
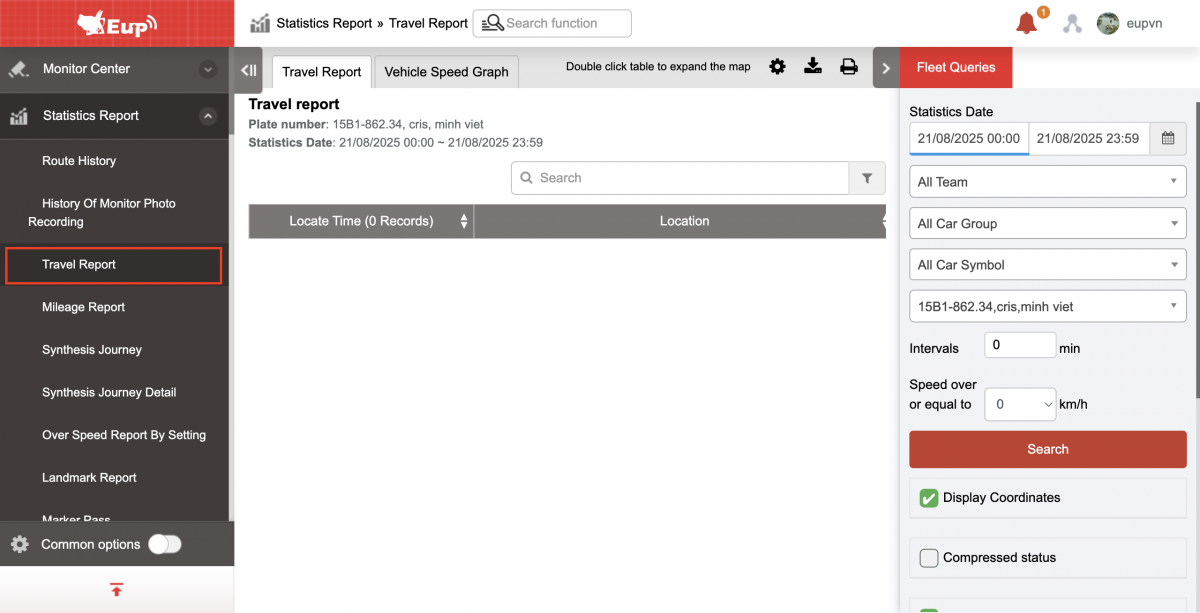
- The function display screen consists of 3 parts:
+ The Fleet Queries section allows users to select vehicles, time, and vehicle status to display in the report;
+ Report Section:
-
Travel report show the details of the vehicle's journey during the time period the user searches;
-
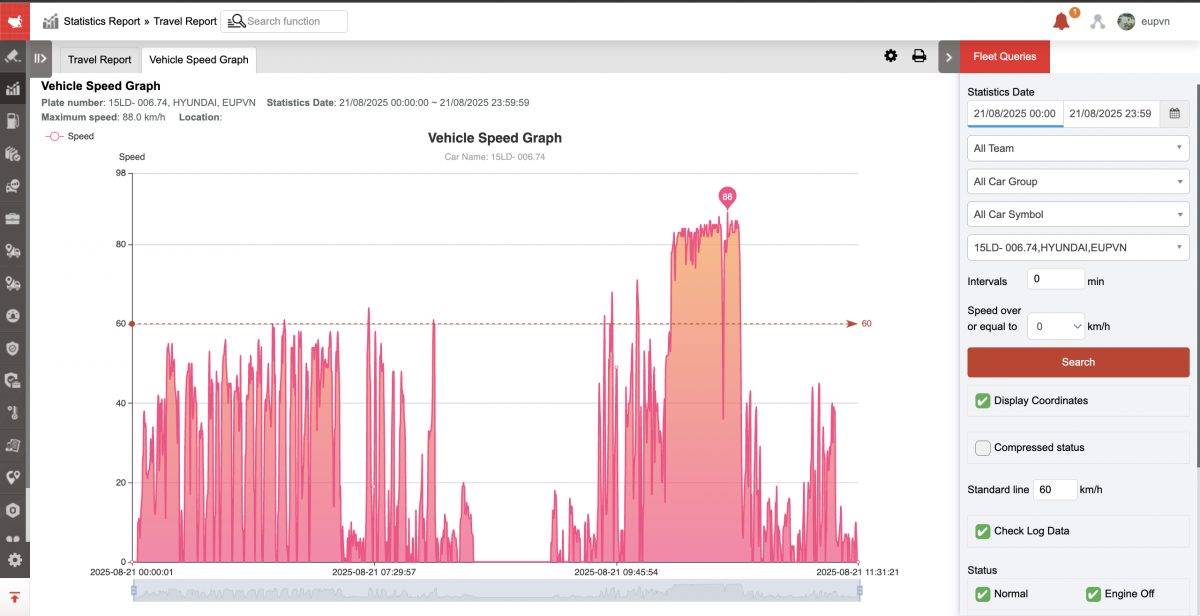
Vehicle speed graph is a description of vehicle speed according to the chart, so that users have a visual view when evaluating vehicle speed.
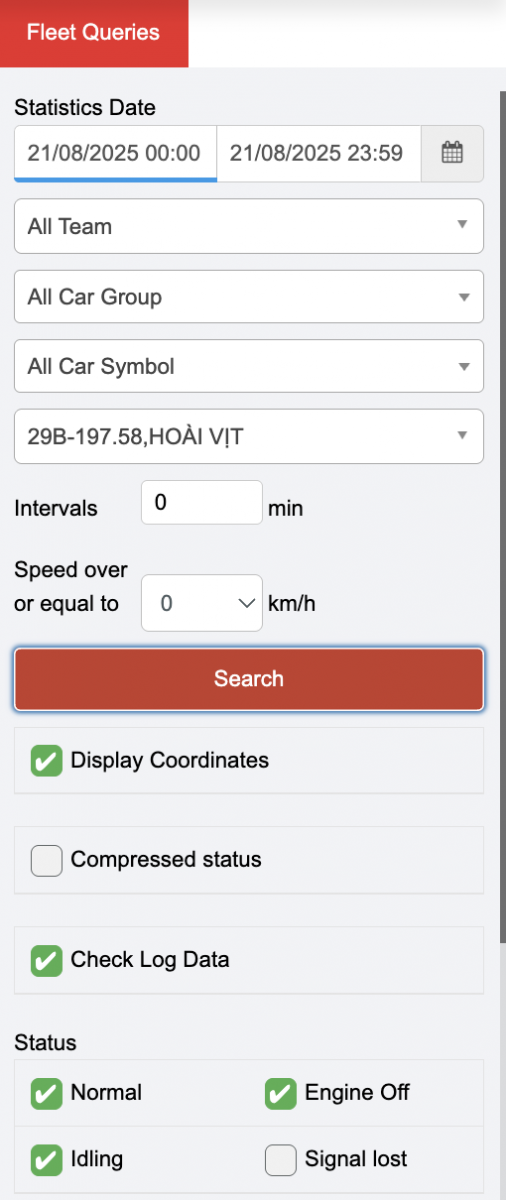
+ Fleet section : Allows users to select the following information to view the report:
-
All team (Vehicle fleet) : User selects the icon
 to select the vehicle fleet to view the report (Vehicle fleet is set up in Settings/Permissions Setting)
 -
Vehicle : User continues to select
to select vehicle -
From : Select the first day you want to see the itinerary
-
To : Select the last day you want to see the itinerary
-
Intervals...min: Data download time/time
-
Speed over or equal to...km/h (Greater Speed...km/h) : The displayed speed will be greater than the speed selected here
-
Checkbox Display Coordinates : Show latitude and longitude to display the vehicle's coordinates
-
Compressed status :Displays the integration status so that the integration system displays status groups with consecutive times.
-
Check Log Data (Checkbox Show device kilometers): Total kilometers from installation to present time
-
Status : User can view route according to each vehicle status. Checkbox the status to view.
-
Click Search to display the results Report details
-
Filter by: KTNL Level or KTKM Level
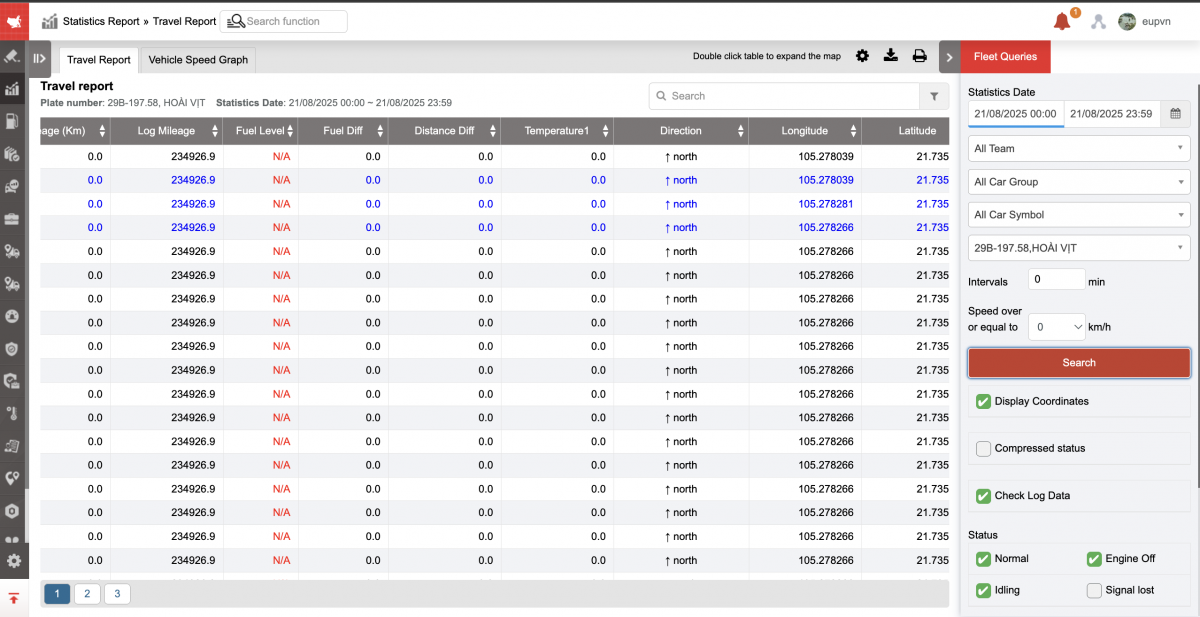
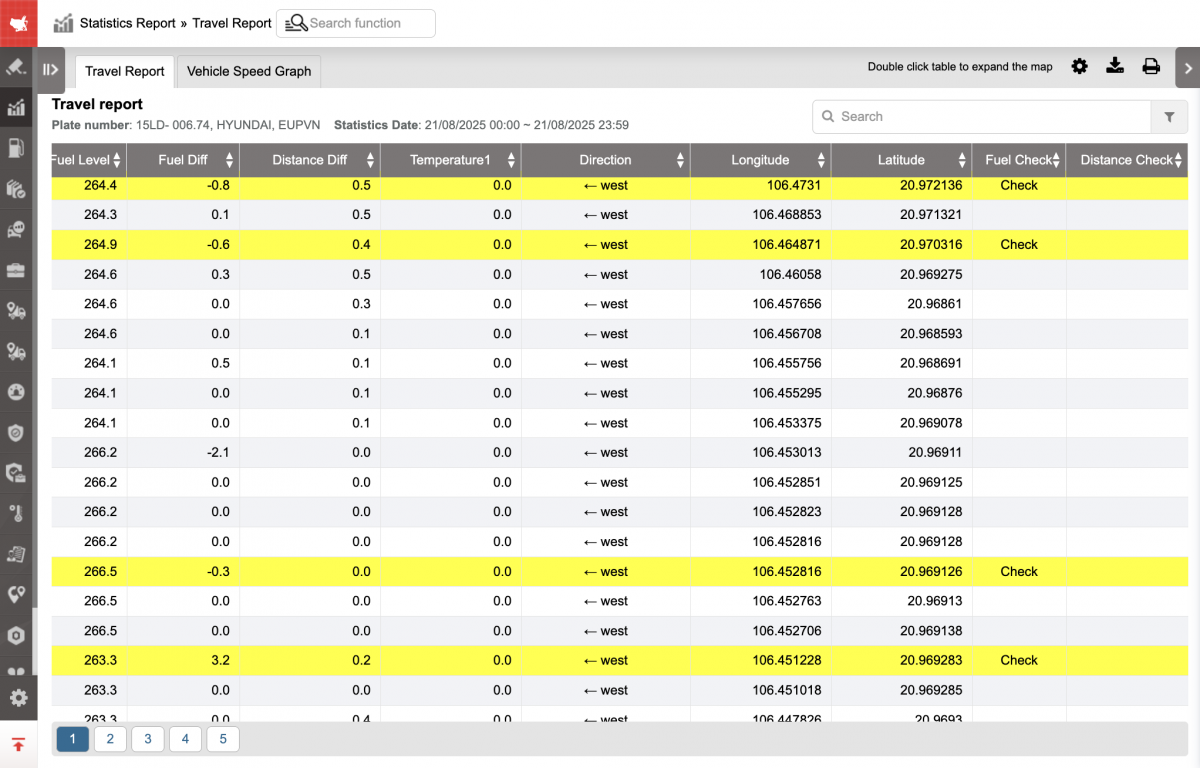
+ The travel report section displays the following information:
-
Locate time: Updated every 30 seconds
-
Location: Update the location the vehicle passed through
-
Landmark: Pre-set landmarks that the vehicle passes through during the positioning period
-
Status: Displays the status of the vehicle at the time of information update, the system will display the cumulative time during the consecutive period the vehicle maintains a status.
-
Speed (km/h): The speed at which the vehicle is traveling
-
Mileage (km)
-
Log Mileage (Original Km Number): When checking the checkbox Show km on device
-
Fuel Level: Number of liters of oil consumed by the vehicle
-
KTNL (Fuel Check): Fuel difference between 2 messages
-
KTKM: Km difference between 2 news
-
Temperature 1:
-
Direction: The direction of the vehicle's movement
-
Longitude, latitude: Displayed if user selects Show coordinates in search section
-
Check NL, check KM: Based on the installed KTNL Level and KTKM Level filters to filter out the messages that need to be checked for NL and KM
* Blue message is a message sending additional return data
-
Vehicle speed graph section : Describes vehicle speed changes in the form of a chart. Based on the chart, users can know the driver's speed within a range and whether it exceeds the allowed speed or not.
 : Maximum speed
+ Select icon  to print report
+ Select the icon  to download the report in excel format
+ Select icons  to customize display columns, customize license plates on reports and set up printing signatures
Update service: Enable optionVN50A to display drivers in the driver column according to driver card swipe history
- Log in to post comments
- Tiếng Việt
- 繁體中文
Mileage Report
1. Purpose
- Mileage Report allowing users to track the activity of each vehicle within a specified time period
2. Implementation conditions
- Users are authorized to Mileage Report in the Authorization function of the system..
3. Implementation instructions
- Go to the Statistics report/Mileage Report.

- The display function screen consists of 2 parts:
+ Fleet Queries section allows users to set time parameters and vehicles to view reports;
+ Mileage Report display the operating time and distance (km) for each vehicle within the selected period

+ Fleet Information Section
Users select the following options to generate vehicle activity reports:
-
Fleet: Click the icon to select a fleet. Default: All fleets.
-
Vehicle: Click the icon to select a specific vehicle. Default: All vehicles.
-
From: Select the start date for the activity report.
-
To: Select the end date for the activity report.
-
Search: Click to display results in the Activity Report section.
- Show undispatched vehicles: Enable to include vehicles with no activity (reports with no data).
- Show by car type group: Enable to display reports grouped by Vehicle Type, as configured in Settings → Groups & Sharing → Driver Group Settings. + Mileage Report: Displays activity reports based on the search criteria selected by the user, specificall:

-
Plate number:
-
Distance traveled : Total distance (km) traveled during the selected period
-
Click on the vehicle row to view details

-
Date: Displays the dates selected in the Search section.
-
Start: The first time of the day when the vehicle starts moving (according to traffic regulations, a vehicle is considered moving when its speed is greater than 3 km/h).
-
End: The last time of the day when the vehicle still sends a signal (the last recorded data from the vehicle).
-
Distance traveled: Total kilometers driven.
+ Select the icon to print the report
+ Select the icon to download the report as excel
+ Select the icon to Custom Field, Plate number field settings, Print signature settings
- Log in to post comments
- Tiếng Việt
- 繁體中文
Synthesis journey
1. Purpose
- Allows users to quickly count total driving time and number of kilometers the vehicle has traveled each day based on the vehicle's running status.
2. Implementation conditions
- The user is authorized to perform the Synthesis journey function in the authorization section.
3. Implementation instructions
- Go to menu Statistics report/Synthesis journey

- The function display screen consists of 2 parts:
+ The Fleet Queries section allows users to set up options,
+ Synthesis journey section displays information about time and number of kilometers in the driver's trip
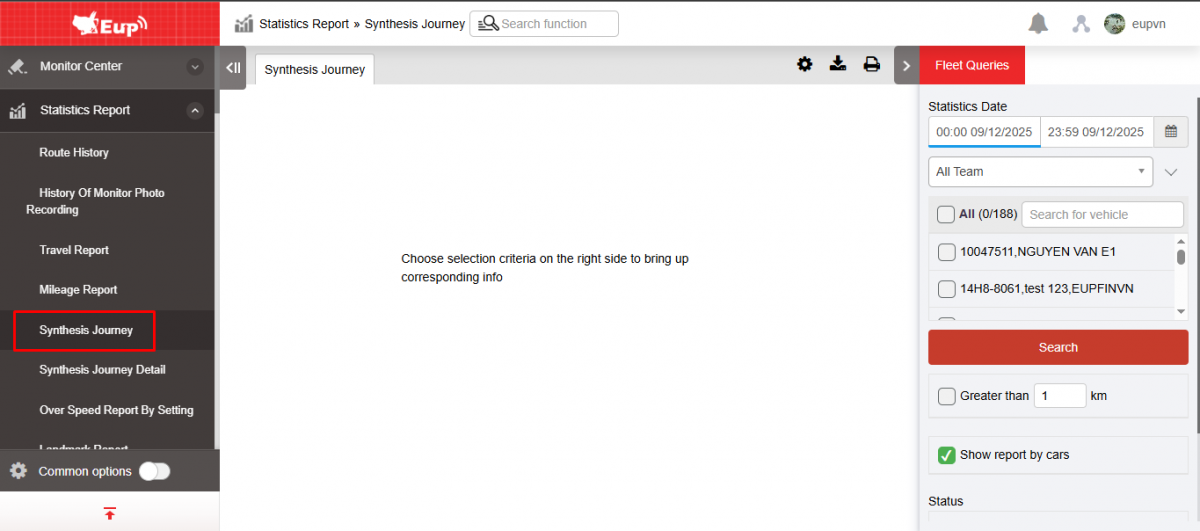
+ Fleet Queries section : User sets the following options:
-
From : User enters the first day to see the itinerary summary
-
To : User enters the last date to view the itinerary
-
All : Check the icon
 to select a fleet
 -
Vehicle : Check the checkbox to select the vehicle you want to view.
-
Click Search to display results in the Trip Summary section.
-
Checkbox Show report by cars: User checks the checkbox to display each vehicle on each tab, uncheck will display all vehicles on one tab. Default is to check and save options by machine. Download and print as options in the checkbox.
-
Status: Check the checkbox to select the status you want to view.
-
Checkbox Normal
-
Checkbox Idling
-
Checkbox Engine off
-
+ The sythesis journey section displays the following information:
-
Start Time: The first time of day the vehicle starts operating
-
Start Address : The first location of the day the vehicle starts operating.
-
End Time : The last time of the day that the status is active
-
End Address : The vehicle's final location of the day at the end time
-
Landmark:
-
Mileage (km): Number of Km the vehicle travels in a day. Only counts the number of km according to the vehicle's operating status.
-
Driving time : Total driving time during the day the vehicle is in running status
-
Fuel consumption (liters) : Number of liters of fuel consumed by the vehicle per day
-
Total : Total Km and total driving time for the day
-
Idling time
-
Idling Fuel consumption (L)
-
Route: Click on Route, playback the vehicle's route
+ Select icon to print report
+ Select the icon to download the report in excel format
+ Select icons to customize display columns, customize license plates on reports and set up printing signatures
* Between reports there may be a difference in the number of kilometers allowed within the limit of no more than 3%
- Log in to post comments
- Tiếng Việt
- 繁體中文
Over speed report by setting
1. Purpose
- Allows users to count vehicles violating speed limits, speed, time and location of violation according to the speed set on the Settings/Warning Settings/Status page.
2. Implementation conditions
- The user is authorized to use the Over speed report by setting in the authorization section.
3. Implementation instructions
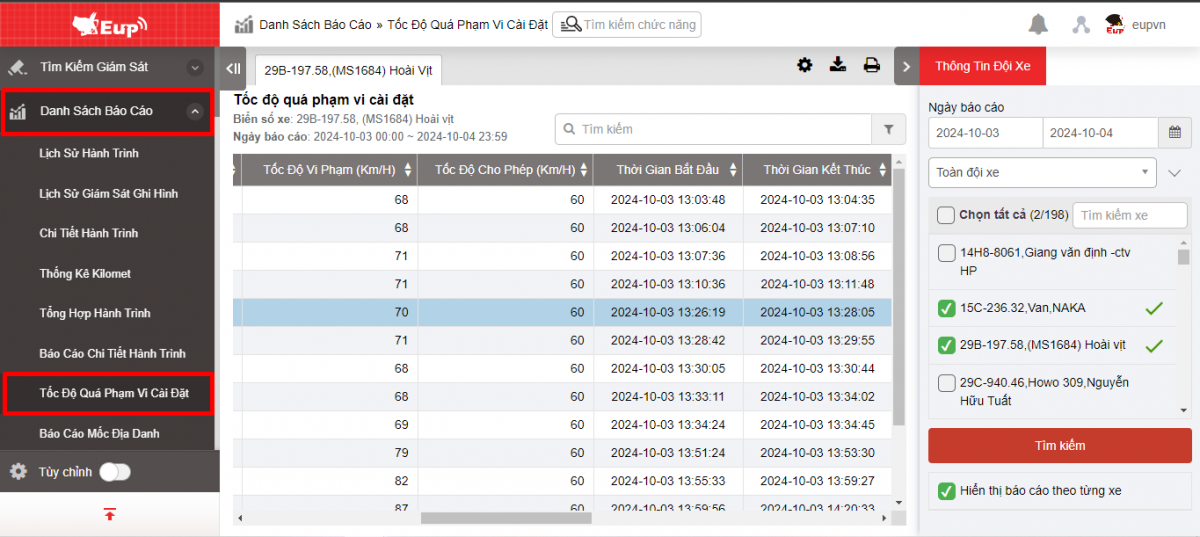
- Go to menu Statistics report/Over speed report by setting
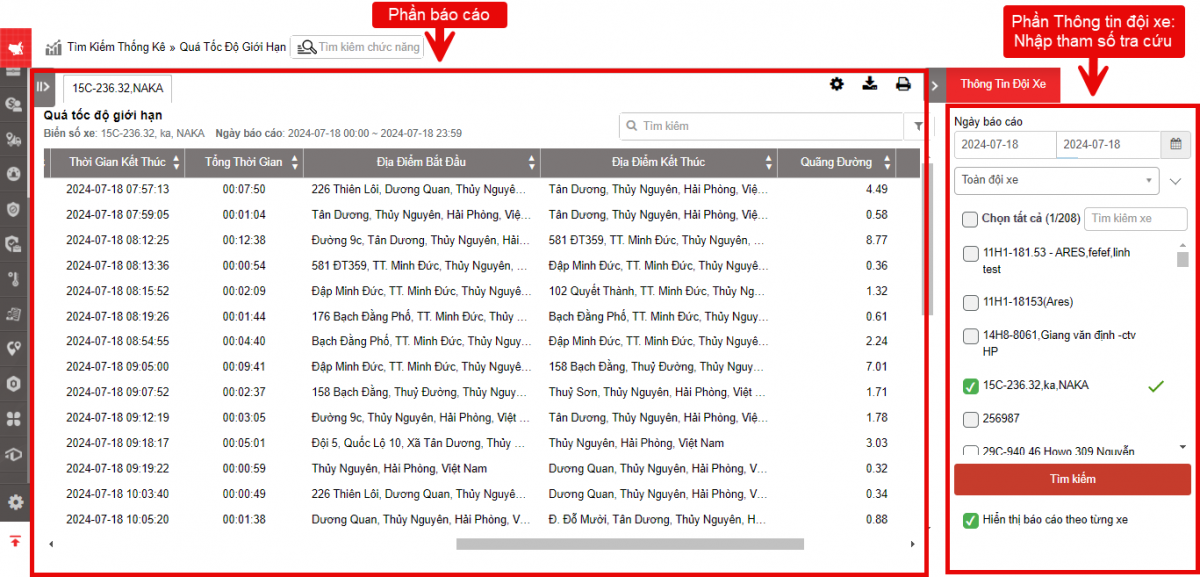
- The function display screen consists of 2 parts:
+ The Fleet Queries section allows users to set up date options and vehicles to look up,
+ The report section displays information about speed limit violations, time and location of the violation.
+ Fleet Queries section : User sets the following options:
-
From : User enters the first day to see the itinerary summary
-
To : User enters the last date to view the itinerary
-
Fleet : Check the icon
to select a fleet -
Vehicle : Check the checkbox to select the vehicle you want to view
-
Press Search to display results in the Speed Limit section
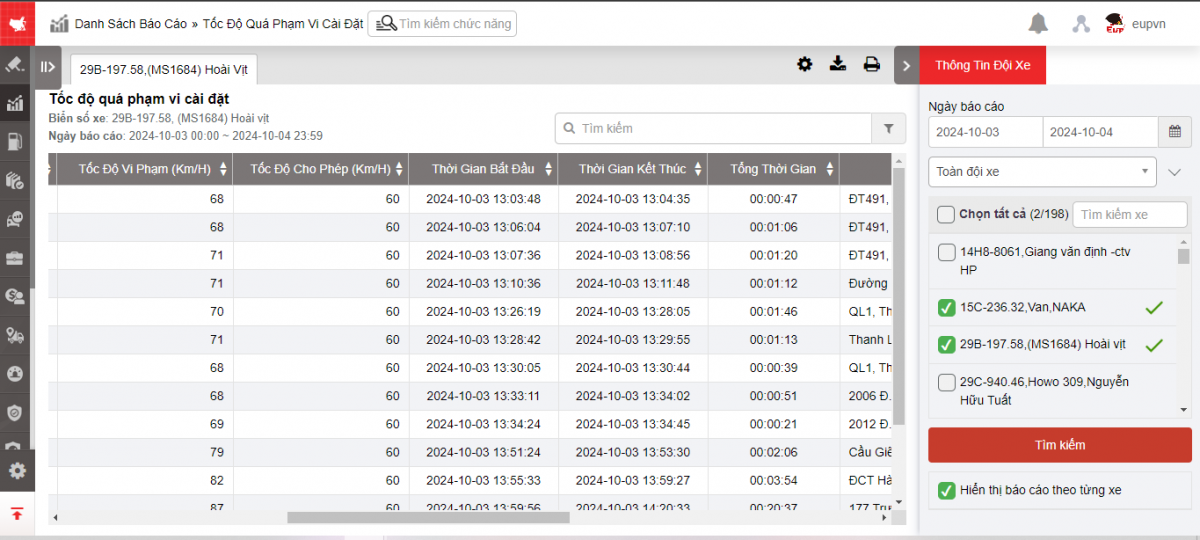
+ Speed over setting range section : Displays the following information:
-
License plate number, driver name, vehicle name, type of operation
-
Speed violation:
-
Allowed Speed: Speed set in Range 1 at Settings/Warning Settings/Overspeed
-
Start Time/End Time: The start time of the violation and the end time of the violation
-
Total Violation Duration: Total start and end time of violation
-
Start Location/End Location: The location where the violation began and ended.
-
Note: After downloading, user enters note content
-
Route: Click on Route to playback vehicle history
-
Select the icon
 to filter the information to check
+ Select icon to print report
+ Select the icon to download the report in excel format
+ Select icons to customize display columns, customize license plates on reports and set up printing signatures
- Log in to post comments
- Tiếng Việt
- 繁體中文
Landmark report
1. Purpose
- Allows the user to check whether the vehicle has passed through the predefined checkpoints
2. Implementation conditions
- Users are authorized to Landmark report in the Authorization function of the system.
3. Implementation instructions
- Go to the Statistics report/Landmark report
- -The display function screen consists of 2 parts:
+ Fleet Queries section allows users to set time parameters and vehicles to view reports;
+ Landmark report displays detailed information about the vehicle's movement to the checkpoint.

+ Fleet Queries section The user selects the following information:
-
To: NSD nhập ngày đầu tiên muốn xem báo cáo
-
From: NSD nhập ngày cuối cùng muốn xem báo cáo
-
Team: The user selects the icon to choose a vehicle team, default is All teams.
-
Car: The user selects the icon to choose a specific vehicle, default is All vehicles.
-
Landmark name: The user enters the name of the landmark to check, or leaves it blank to check all landmarks.
-
Group Landmark: Default is All. The user can select a specific landmark group by clicking the icon.
-
Vehicle status: Includes 2 statuses: Stopped or Running. The user can filter by each status or all statuses.
-
Search: Displays the report information in the Landmark Report section.
-
Filter: Landmark filtering tool.

-
Click the Settings icon to view the report by date or by vehicle.

-
Checkbox
 To merge landmarks
 -
Select the vehicle status checkbox to filter data by vehicle status

+ The Landmark Report section includes the following information:
-
License plate
-
Landmark: Displays the landmark icon
-
Customer code: The predefined customer code when creating the landmark
-
Date: The date when the vehicle has a status at the landmark
-
Landmark name
-
Vehicle status: The vehicle’s status at the landmark, including two states: Stopped or Running
-
Duration: The total time the vehicle stayed at the landmark
-
Arrival time: The time when the vehicle first appeared at the landmark
-
Departure time: The last time the vehicle was still at the landmark
Note: The user can click the expand icon  to display detailed information about the time the vehicle passed through the landmark.
+ Select the icon to print the report
+ Select the icon to download the report as excel
+ Select the icon to Custom Field, Plate number field settings, Print signature settings
- Log in to post comments
- Tiếng Việt
- 繁體中文
Working
1. Purpose
- Allows users to check the concrete pouring status of each vehicle or the entire fleet over time.
2. Implementation conditions
- Users are authorized to Worrking function on CRM system
3. Implementation instructions
- Go to menu Statistics report/Working

- The function display screen consists of 2 parts:
+ The Fleet Queries section allows users to search for information based on vehicle and time criteria;
+ Working section displays detailed concrete discharge time of each vehicle

+ Fleet Queries section : User selects the following information
-
From : User enters the first date he wants to view the report
-
To : User enters the last date to view the report
-
Fleet : User selects icon
 to select fleet, default is Whole fleet
 -
Vehicle : User selects icon
to select specific vehicle, default is All vehicles -
Click Search to display the report information in the Concrete Discharge Query section
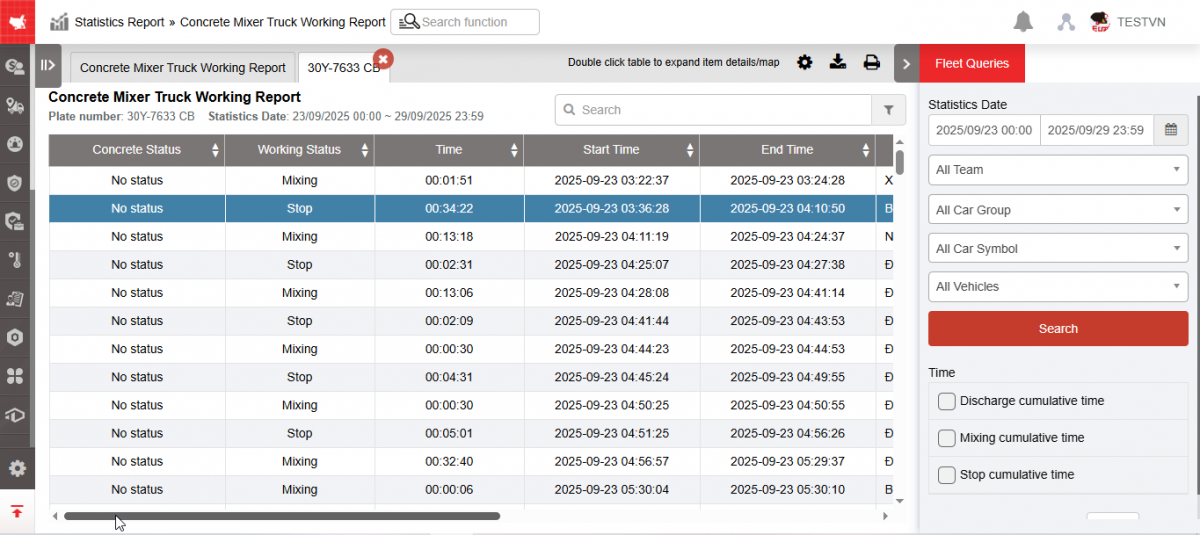
+ Working section : Allows displaying the following information:
-
Plate number
-
Driver: Driver's name
-
Discharge cuculative time : Is the time the vehicle takes to pour concrete
-
Click on the line you want to see details, the system displays the detailed screen:
-
Concrete status
-
Working status
-
Start time : Time the vehicle starts pouring concrete
-
End time: Time the vehicle stops pouring concrete
-
Time : Displays total concrete pouring time
-
Address: Location of vehicle pouring concrete
-
Milestone name : Milestone name for concrete pouring
-
+ Select the icon  to print the report
+ Select the icon  to download the report in excel format
+ Select the icon  to set the display or hide or change the sort order of the report columns
- Log in to post comments
- Tiếng Việt
- 繁體中文
Tùy chọn tính năng (đã xóa: vì đã có báo cáo mốc)
- Log in to post comments
- Tiếng Việt
- 繁體中文
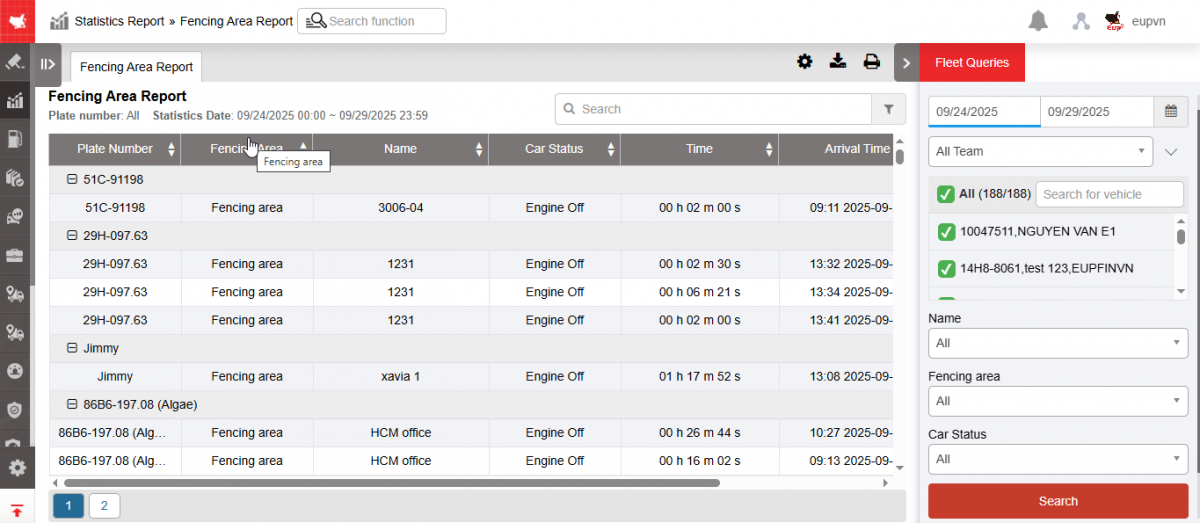
Fencing Area Report
1. Purpose
- Allows users to count the number of times each vehicle enters and exits the restricted area according to the selected time
2. Implementation conditions
- Users are authorized Fencing Area Report at the system's authorization function.
3. Implementation instructions
- Go to menu Statistics report/Fencing Area Report
- The function display screen consists of 2 parts:
1. The Fleet Queries section allows users to select conditions for displaying reports.
2. The Fencing Area Report section displays specific information about the vehicle entering and exiting the restricted area.
+ Fleet Queries section , user selects the following information
-
From : User enters the first date he wants to view the report
-
To : User enters the last date to view the report
-
Fleet : User selects icon
to select fleet, default is Whole fleet -
Vehicle : User selects icon
to select specific vehicle, default to all vehicles -
Name : User enters the name of the Limit area to check or selects from the list, leave blank if you want to check all Limit areas
-
Fencing area: Default all, users can select each type of restricted area by selecting the icon
(there are two types: Restricted area and Factory) -
Car status : Includes 2 statuses: Parked or Running, users can choose to count by each status or all statuses.
-
Click Search to display report information in the Limited Area Report section
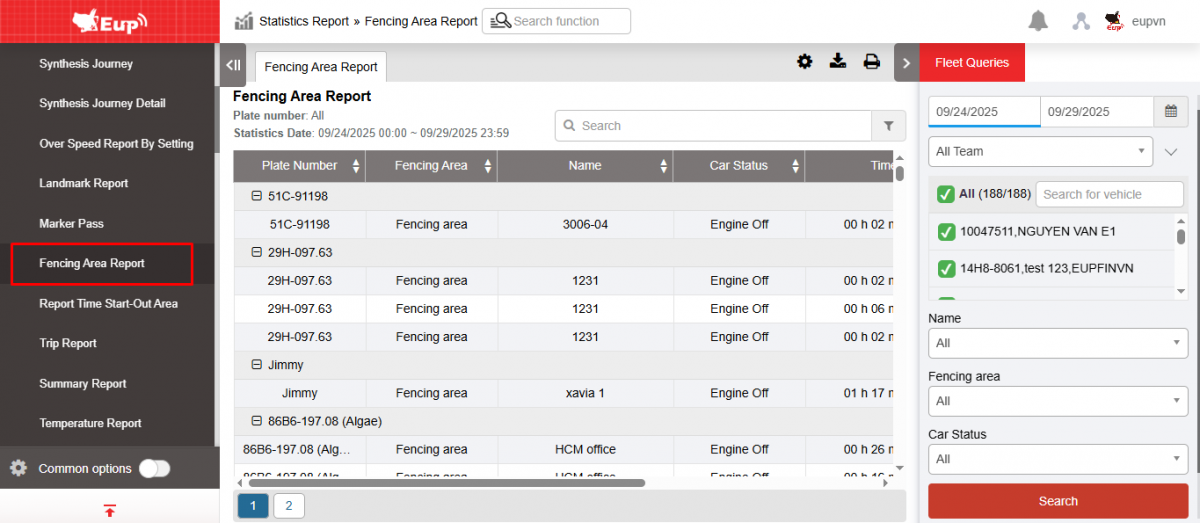
+ The Fencing Area Report section includes the following information:
-
Plate number
-
Fencing Area : Displays the restricted area type as Factory or Restricted Area
-
Date : Date the vehicle is in the restricted area
-
Name: Information taken from page basic_setting_new_construction_site
-
Vehicle status: Vehicle status when reaching the restricted area, including 2 statuses: Stopped or running
-
Time: The time the vehicle is in the restricted area
-
Arrival time: Is the time the vehicle starts to appear in the restricted area
-
Departure time: Is the last time the vehicle is in the restricted area
-
Note : User clicks on the mark
 to display all vehicle entry and exit times in restricted areas.
+ Select the icon to print the report
+ Select the icon to download the report in excel format
+ Select icons to customize display columns, customize license plates on reports and set up printing signatures
- Print signature settings:

- Log in to post comments
- Tiếng Việt
- 繁體中文
Report Time Start-Out Area
1. Purpose
- Allows users to count the number of times each vehicle enters and exits the restricted area according to the selected time
* This report is different from the Restricted Area Report in that this report only displays the correct Time the vehicle starts arriving at the restricted area and the Time the vehicle leaves the restricted area, and the messages of engine on/off and movement within that area will not be displayed.
2. Implementation conditions
- Users are authorized Time Start-Out Area Report at the system's authorization function.
3. Implementation instructions
- Go to menu Statistics report/Time Start-Out Area
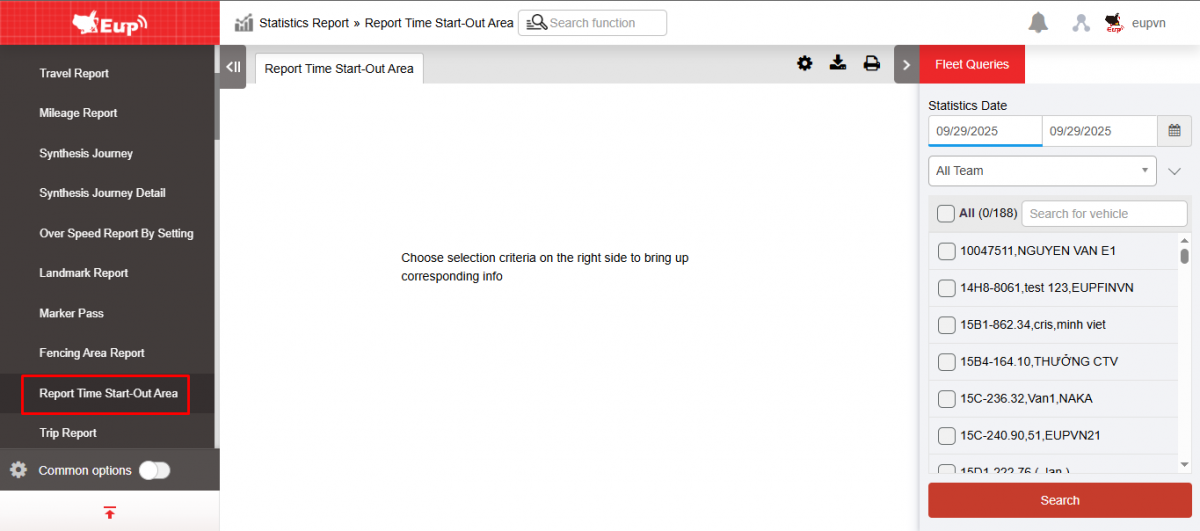
- The function display screen consists of 2 parts:
+ Vehicle Queries section is the section that allows users to select conditions to display the report.
+ The Report Time Start-Out Area section displays specific information about vehicles entering and exiting restricted areas.
+ Fleet Queries section , user selects the following information
-
From : User enters the first date he wants to view the report
-
To : User enters the last date to view the report
-
Fleet : User selects icon
to select fleet, default is Whole fleet -
Vehicle : User selects icon
to select specific vehicle, default to all vehicles -
Click Search to display the report information in Time Start-Out Area Report section
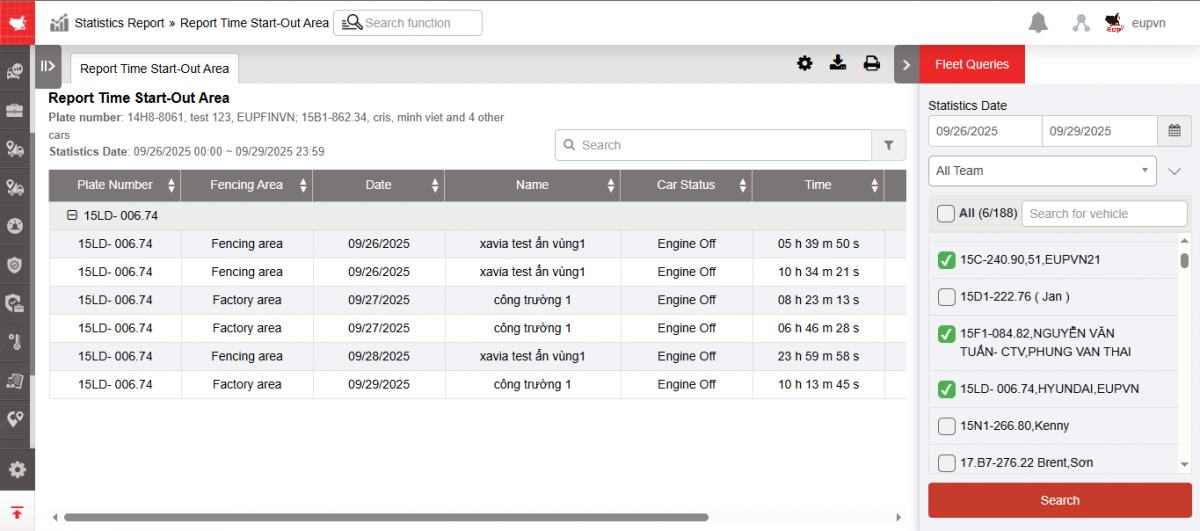
+ The Time Start-Out Area Report section includes the following information:
-
Plate number
-
Fencing area: Displays the restricted area type as Factory or Restricted Area
-
Date : Date the vehicle is in the restricted area
-
Name: Information taken from the Settings/Customize Restricted Area page (https://fms.ctms.vn/#basic_setting_new_construction_site.html)
-
Car status: Vehicle status when reaching the restricted area, including 2 statuses: Stopped (parked, stopped without turning off the engine) or vehicle is running
* Vehicle status is based on the status when the vehicle reaches the restricted area.
-
Time: The time the vehicle is in the restricted area
-
Arrival time: Is the time the vehicle starts to appear in the restricted area
-
Departure time: Is the time the vehicle leaves the restricted area
* If the vehicle enters the restricted area and stops until now and has not left the restricted area, Arrival Time is recorded. Departure Time is recorded, the last message is recorded, and when the vehicle leaves the restricted area, the Departure Time is updated.
* If the entry-exit times between two records are close together, the report will only record Arrival Time of the first record and Departure Time of the second record. The time regulations are as follows:
+ Vehicle running status <= 30s
+ Vehicle parking status (Parking without engine off, Parking without engine off) <= 15 minutes
-
Note : User clicks on the mark
to display all vehicle entry and exit times in restricted areas.
+ Select the icon to print the report
+ Select the icon to download the report in excel format
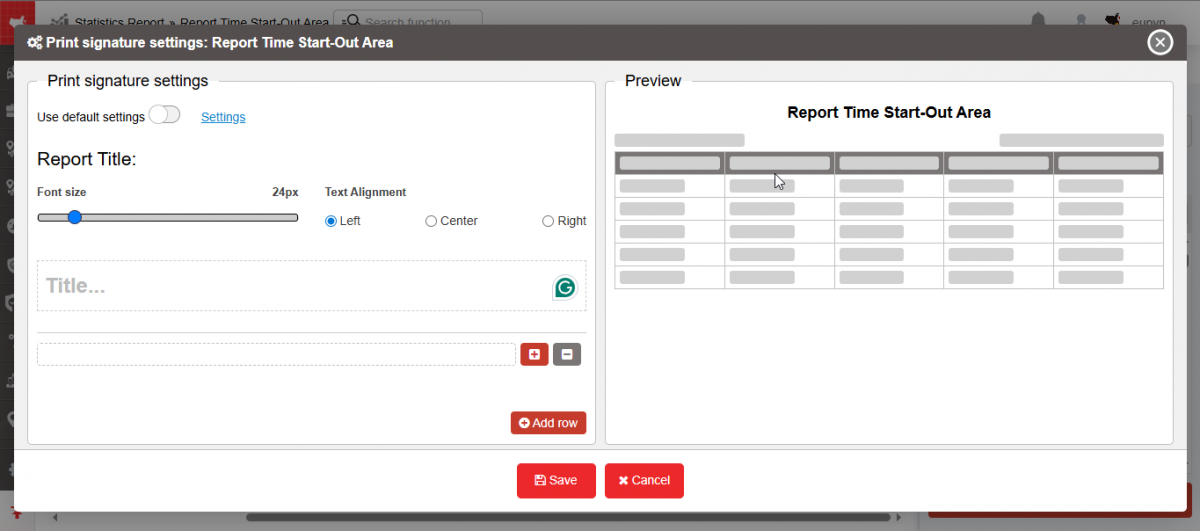
+ Select icons to customize display columns, customize license plates on reports and set up printing signatures
-
Print signature settings:
Trip Report
1. Purpose
- This report allows users to monitor drivers’ daily activities, determine whether they followed the planned route, and view detailed information about the driving time of each driver throughout the day
2. Implementation conditions
- Users are granted access rights to the Trip Report on the system CRM
3. Implementation instructions
- Go to the Statistics report/Trip Report
- The display function screen consists of 2 parts:
+ Fleet Queries section: The system allows users to select the time period, vehicle fleet, and specific vehicle to view the report
+ Trip Report: Display detailed trip information, distance traveled (km), and driving time

+ Fleet Information Section
Users select the following options to generate vehicle activity reports:
-
To: User enters the first date to view the report
-
From: User enters the last date to view the report
(Enable option VN22B - maximum lookup time 31 days, only for Daily Summary Report)
-
Team car: User selects the icon to select the fleet, default is All fleet
-
Vehicle: User checks the checkbox to select a specific vehicle.
-
Click Search to display Trip Report information in the section.
-
Select the checkbox for each status to display a summary report for each status
-
Select the Show data by vehicle checkbox: The report displays data by vehicle
-
Download all: one file - one sheet per car, each sheet includes all days in the search period
-
Download all by vehicle: one file per vehicle, one sheet per file including dates within the search period
-

-
Don't checkbox Show data by vehicle: Report shows data by day
-
Download all: one file - each car each day is 1 sheet
All by car: one file for each car, each file includes 1 day as 1 sheet
-
+Trip Report The specific information displayed is as follows
-
Start Time: Current time of vehicle signal reception at specific address
-
Customer: Customer at pre-set milestone
-
Journey: The location when the vehicle is parked, without turning off the engine or when the vehicle is moving from point A to point B
-
Number of KM: Number of Km the vehicle travels from point A to point B
-
Total time: Time it takes the vehicle to travel from point A to point B
-
Status: The final state of the vehicle when it is about to move to a new location
-
The last line summarizes statistical information so that users have an overview of the driver's activities during the day:
- Driving time: Total time the vehicle is in the Running state
- Stopped time: Total time the vehicle is in the Stopped state
- Stopped without turning off the engine: Total time the vehicle is in the Stopped state without turning off the engine
- Active: Total time the vehicle is in the Active state
- Vehicle usage time: The time from the first time of the day the driver starts the vehicle to the last time of the day the driver turns off the vehicle
- Express km: The number of km the vehicle travels on the expressway
- Express toll:
-
Note: User clicks on the line to display details about the vehicle's route.
+ Select the icon to print the report
+ Select the icon to download the report as excel
+ Select the icon to Custom Field, Plate number field settings, Print signature settings
- Log in to post comments
- Tiếng Việt
- 繁體中文
Summary Report
1. Purpose
- Allow users to generate statistics on the status of all drivers within a specified time period..
2. Implementation conditions
- The user is granted permissions for the function on the system CRM.
3. Implementation instructions
- Go to the Statistics report/Summary Report

-The display function screen consists of 2 parts:
1.Summary Report allow generating vehicle status statistics at different times of the day
2. Fleet Queries section allows users to set time parameters and vehicles to view reports;

+ Fleet Information: Allows the user to select a time range to generate a summary table of all drivers. After selecting the time range, the user clicks the Search button
+ Summary Report : Display the full list of drivers who operated vehicles within the selected search period, based on the information in the Statistics section of the Driver Status function
-
License Plate
-
Driver: Driver’s name
-
Start Time: The time the driver started driving within the selected search period
-
End Time: The time the driver finished driving within the selected search period
-
Driving Time: Total driving time of the driver within the selected search period
-
Idle Time (engine off): Total stop time of the driver within the selected search period
-
Idle Time (engine on): Total time the vehicle was idling without the engine turned off, within the selected search period
-
Active Time: Total time the vehicle was in active status within the selected search period
-
Vehicle Usage Time: Total time of vehicle usage within the selected search period (End Time – Idle Time, or Working Time + Idle Time)
-
Working Time (HH:MM:SS): Total time = Idle Time (engine on) + Driving Time
-
Non-Active Time (HH:MM:SS): Total non-active time = Idle Time (engine off) = 24:00:00 – Vehicle Usage Time
-
Total Distance (Km): Total kilometers driven by the driver within the selected search period
-
Overspeed Count: Number of times the driver exceeded speed limits
-
Fuel Consumption: Total fuel consumed
-
Note: Users can click on each row to view detailed information of each driver by day.
+ Select the icon to print the report
+ Select the icon to download the report as excel
+ Select the icon to Custom Field, Plate number field settings, Print signature settings
- Log in to post comments
- Tiếng Việt
- 繁體中文
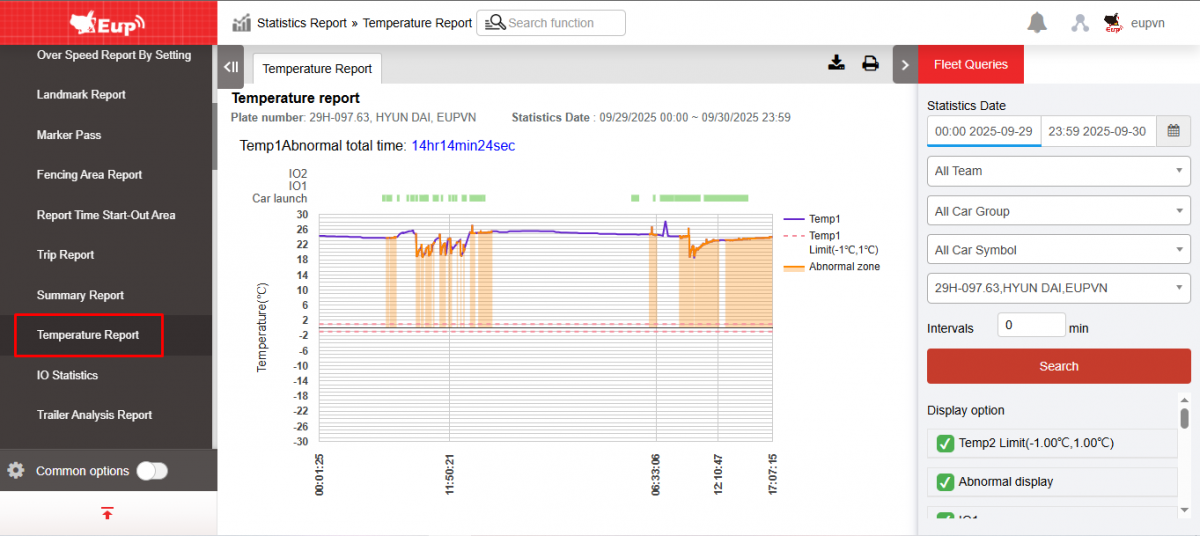
Temperature report
1. Purpose
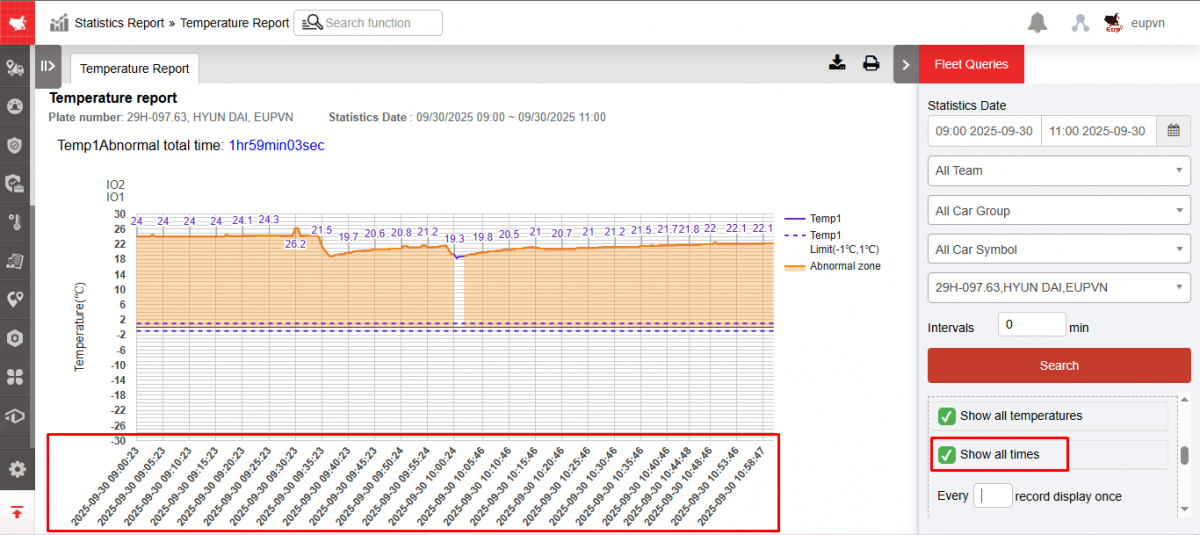
- Allows users to quickly check the time when the vehicle has an abnormal temperature. At the same time, through the temperature graph, users have an intuitive view of the temperature change situation in the vehicle, thereby assessing the compliance with the temperature according to the pre-set standard threshold of each vehicle.
2. Implementation conditions
- Users are authorized on the CRM system
3. Implementation instructions
- Go to menu Statistics report/Temperature report
- The function display screen consists of 2 parts:
+ Fleet Queries section allows users to select vehicles and the time they need to view the temperature graph;
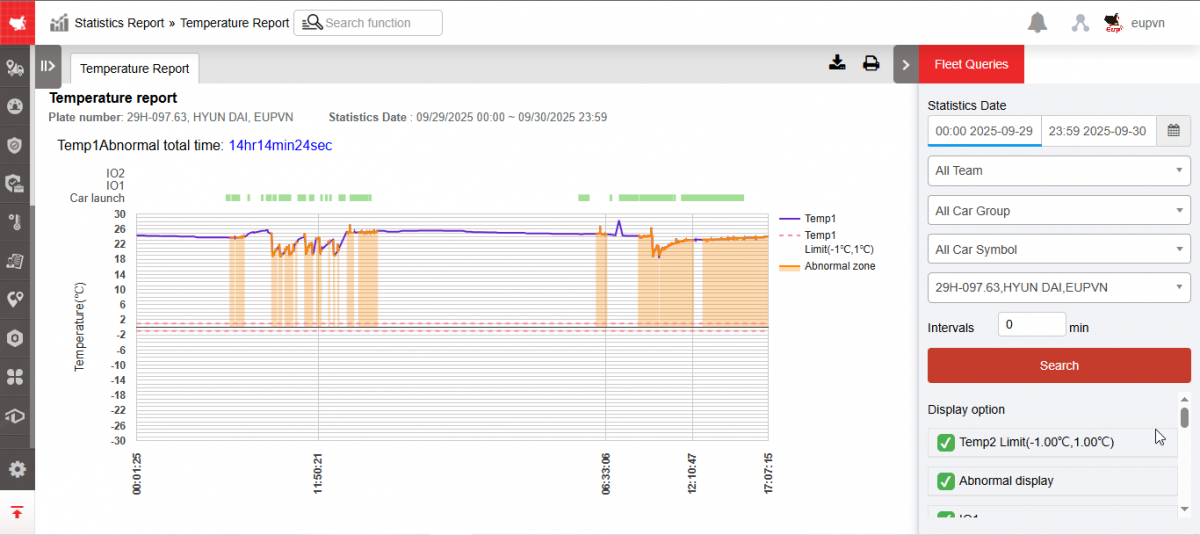
+ The Temperature report section displays a summary of the total time the vehicle had an abnormal temperature and a temperature graph of the vehicle
+ Fleet Queries section : Includes the following information
-
From : Allows users to select the first date and time they want to view the graph.
-
To : Allows users to select the last date and time they want to view the graph.
-
Fleet : Default is entire fleet and allows to select individual fleets
-
Vehicle : Default is any vehicle in the fleet and the user selects
 to select the vehicle to view the graph
 -
Display option:
-
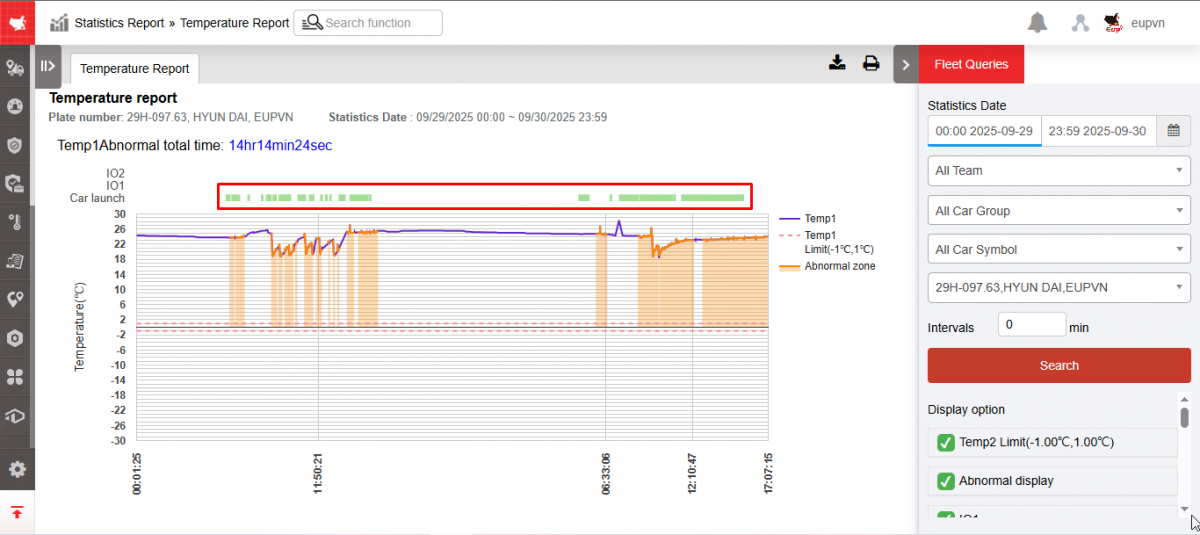
IO1/IO2 Name: Displays the IO1 and IO2 names set at the IO Temperature tab of the Settings/Basic Information page respectively (Example image: IO1 and 2 names are set as Switch to 1 and Switch to 2)
-
Vehicle Start: Check to enable display of green line
-
-
Horizontal divider : Displays horizontal divider

-
Show all temperatures: Check to show specific temperatures on the graph
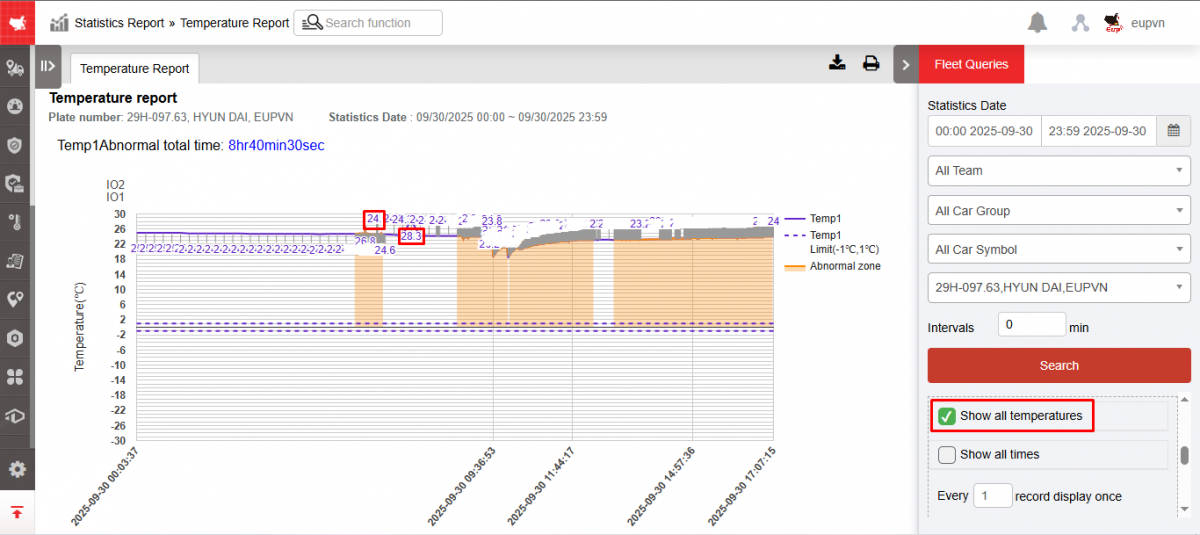
-
Show all times: Select to display specific time on the graph. User can choose the time interval to display by changing the number of "pen" in the Display each pen section with 1 pen corresponding to 30
-
Temp upper/lower limit: The standard temperature threshold has been preset in the Settings/General Information/Temperature & IO function . Only when the vehicle temperature is within this temperature range is the vehicle considered to have a normal temperature.
-
Click Search to display the graph results.
+ The Temperature Graph section includes the following information:
-
The query interval description line
-
Graphical section
+ Select the icon to print the report
+ Select the icon to download the report in excel format
- Log in to post comments
- Tiếng Việt
- 繁體中文
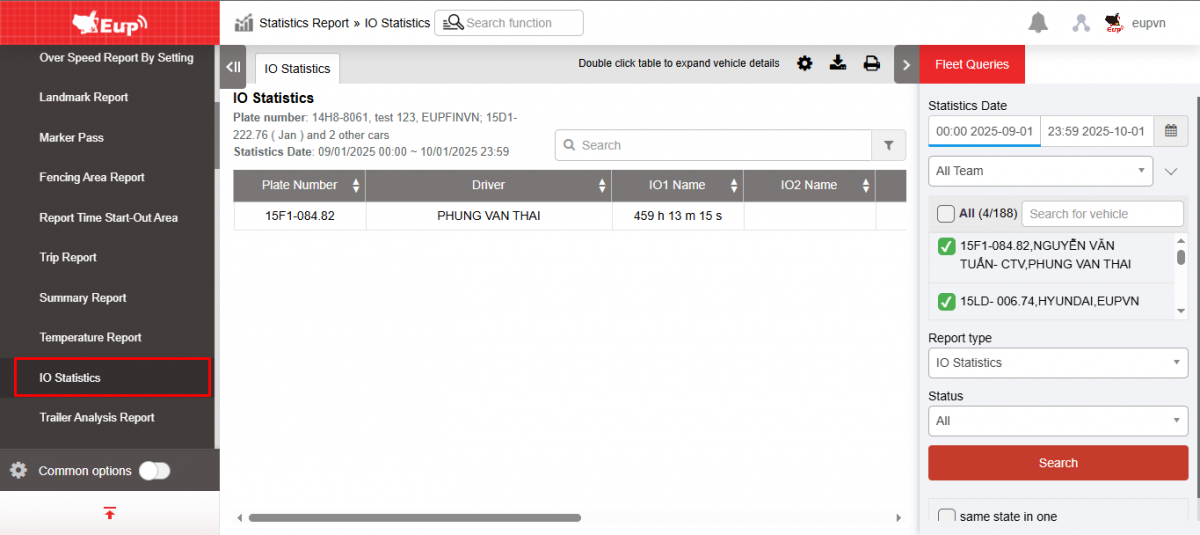
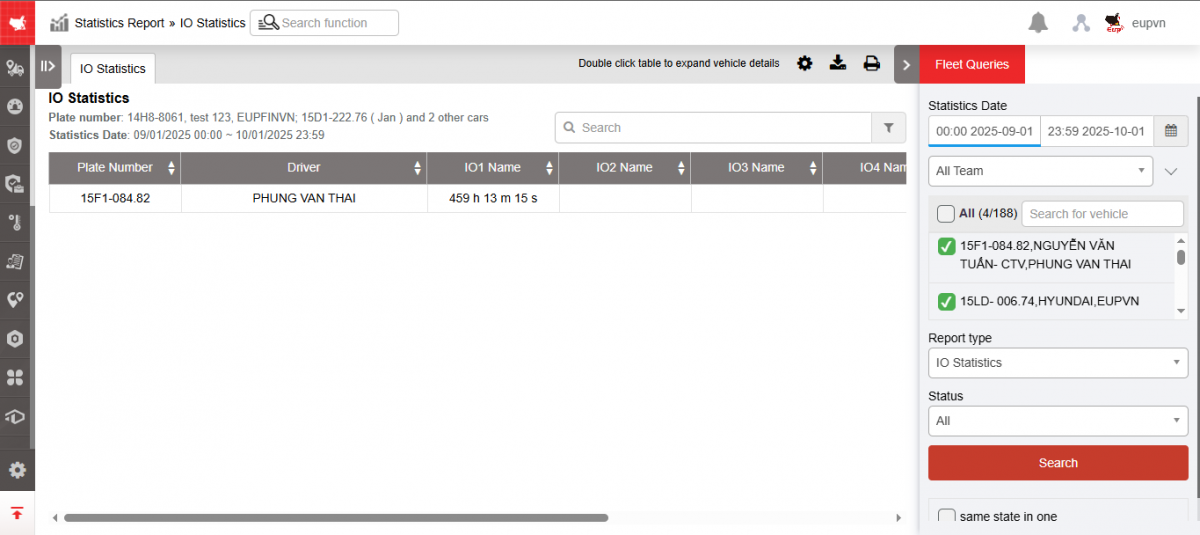
IO Statistics
1. Purpose
- Support users to check the vehicle's air conditioner usage time according to the selected time period
2. Implementation conditions
- Users are authorized to IO Statistics on the CRM system
3. Implementation instructions
- Go to menu Statistics report/IO Statistics
- The function display screen consists of 2 parts:
+ The Driver Information section allows users to select information about time and air conditioning status;
+ The Report section displays information about the time the air conditioner is turned on and off.
+ The Driver Information section allows users to set up search information as follows:
-
From : Select the first date and time that the user wants to see
-
To : Select the last date and time that the user wants to see
-
Fleet : Default is the entire fleet, user selects the icon
 to select the fleet to view
 -
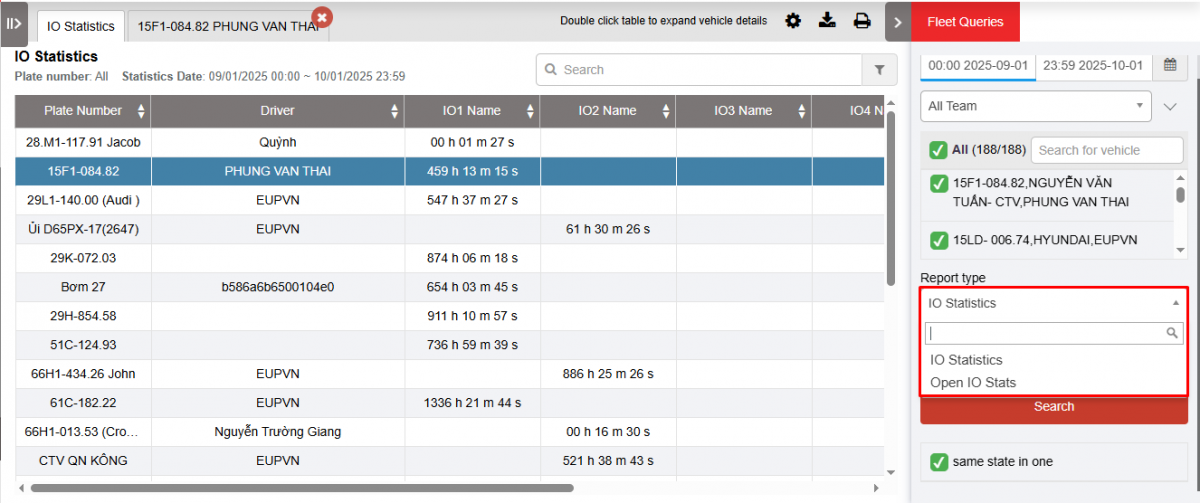
Report type : Select the type of report you want to view
-
IO statistics
-
Open IO statistics
-
-
Status : Default is all statuses, user selects icon
to select status to look up:-
Open : Corresponds to Open state - Air conditioner opens
-
Close : Corresponds to Close status – Air conditioner is off
-
All: Summary of 2 states Open and Close
-
-
Click Search to display report details in the Conditioning Report section.
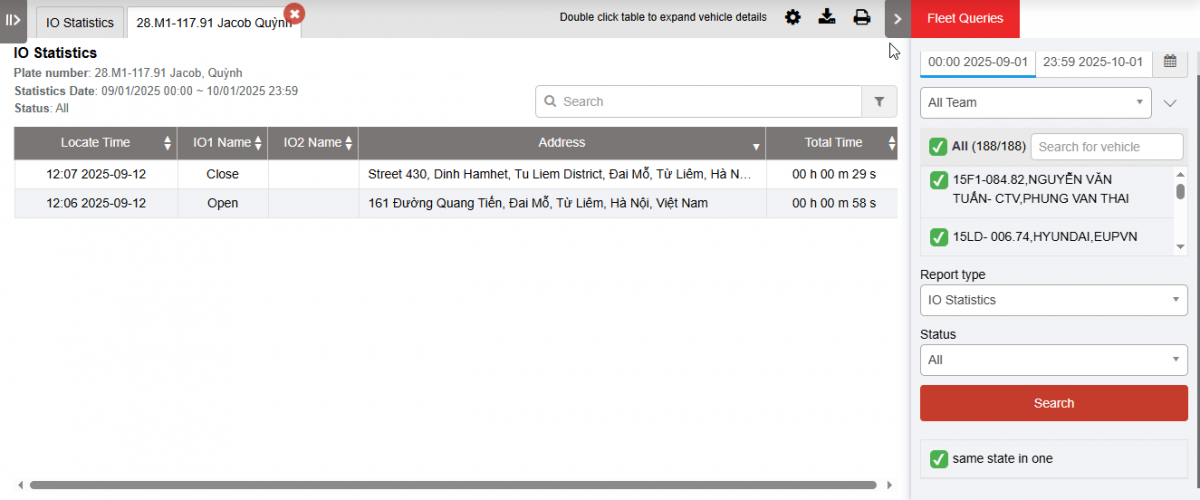
+ Report section : Allows users to view details of air conditioner on and off time. There are 3 types of reports including IO Statistics, Open IO Statistics
-
License plate number
-
Name : Driver's name
-
Name IO1 : 1st air conditioning port, displays total time according to search status (Door signal, if the car is equipped with a door open/close signal)
-
IO2 Name : 2nd air conditioning port, displays total time according to search status (Air conditioning signal, if the car is equipped with air conditioning signal)
-
User selects the vehicle line to view details and double-clicks to display details for each vehicle and the time of each specific status.
-
Positioning time:
-
IO1: Status of the 1st air conditioning port (Door signal, if the vehicle is equipped with a door open/close signal)
-
IO2: Status of the 1st air conditioning port (Air conditioning signal, if the vehicle is equipped with an air conditioning signal)
-
Address: Vehicle address with air conditioning on/off status
-
Total time: Total time the vehicle has the air conditioner on/off at one position
Open IO Statistics
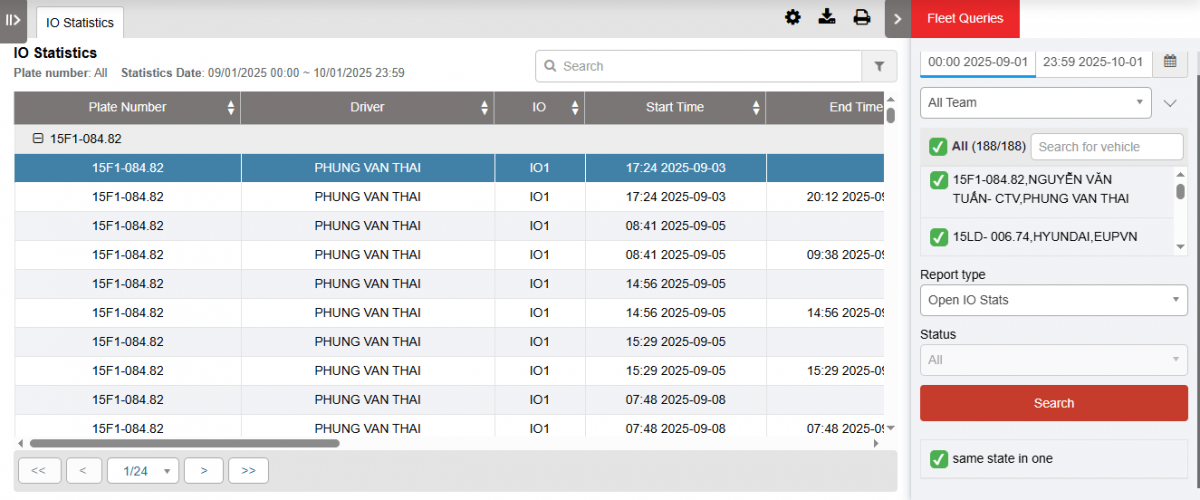
- License plate number:
- Driver name : Current driver name is logged in with swipe card or driver manually assigned on the system by the user
- IO Name : Name of the connection port for the door open/close sensor (IO1: Door signal, IO2: Air conditioner signal)
- Start time : Time to start turning on the air conditioner
- End time : Time to end the air conditioner on
- Total time on machine : Total time on air conditioner
- Engine on time when stopping the car : Total time the air conditioner is on when the car is stopped without turning off the engine and parked
- Starting location : Location where the air conditioner starts to turn on
- End Location : End Location turn on the air conditioner
- Route : Review the route with the car's air conditioner on
General air conditioning report

- License plate number
- Day
- Number of kilometers
- Number of kilometers the car has air conditioning on
- Operating time: is the time the vehicle is running + the time it stops without turning off the engine
- Time the car operates with the air conditioner on: is the time the car is running + the time the car stops without turning off the engine and the car turns on the air conditioner (greater than or equal to\ Operating time )
- Time of stopping the car without turning off the engine: Is the total time of stopping the car without turning off the engine in blue status (greater than or equal to Time of stopping the car without turning off the engine and turning on the air conditioner)
- Time of stopping the car without turning off the engine and turning on the air conditioner: Is the total time the car has the air conditioner on when stopping the car without turning off the engine, blue status
+ Select the icon to print the report
+ Select the icon to download the report in excel format
+ Select icons to customize display columns, customize license plates on reports and set up printing signatures
- Log in to post comments
- Tiếng Việt
- 繁體中文
Trailer analysis report
1. Purpose
- Allows users to check statistical data on the number of trips, usage rate, and trailer operating time in the form of a chart. At the same time, through the chart, users have a visual view of the trailer usage situation.
2. Implementation conditions
- Users are authorized on the CRM system
3. Implementation instructions
- Go to menu Statistics report/Trailer analysis report
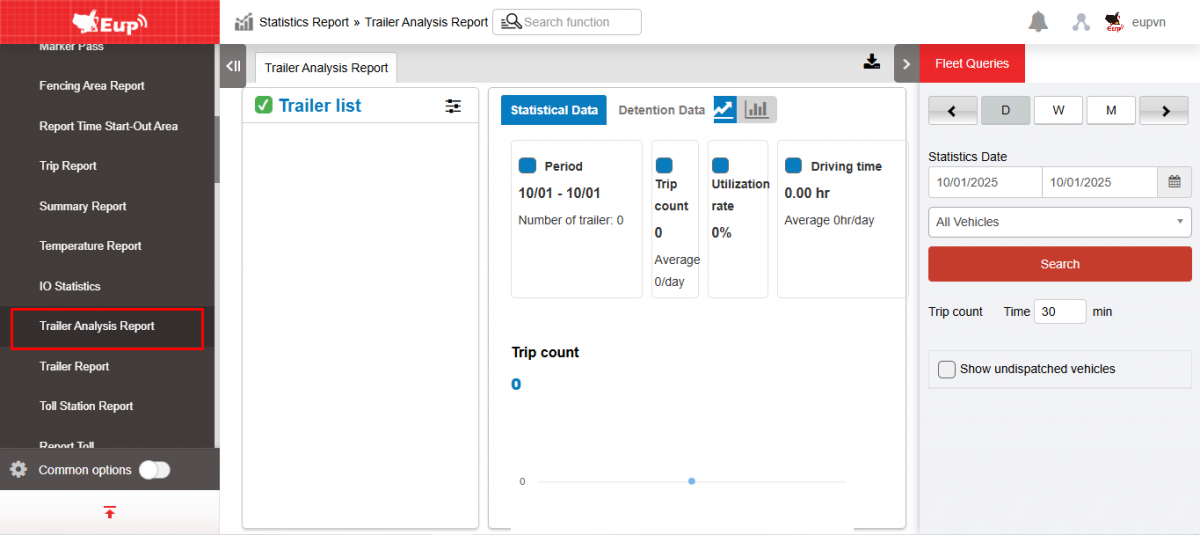
- The function display screen consists of 2 parts:
+ Fleet Queries section allows users to select the vehicle and time they want to view.
+ Trailer analysis report shows the number of trips, usage rate, and trailer operating time in a graph format.
+ Fleet Queries section allows users to select the vehicle and time they need to view:
-
Select view by day/week/month
-
Select report date From...to
-
Choose a car
-
Trip count Time...min
-
Checkbox Show undispatched vehicles
-
Click Search to display results.
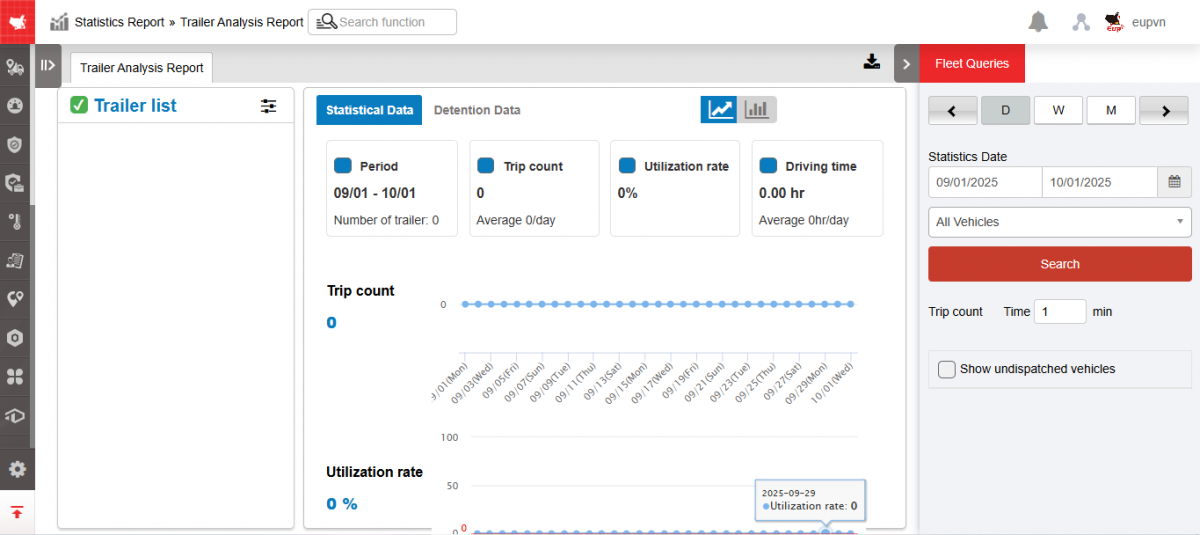
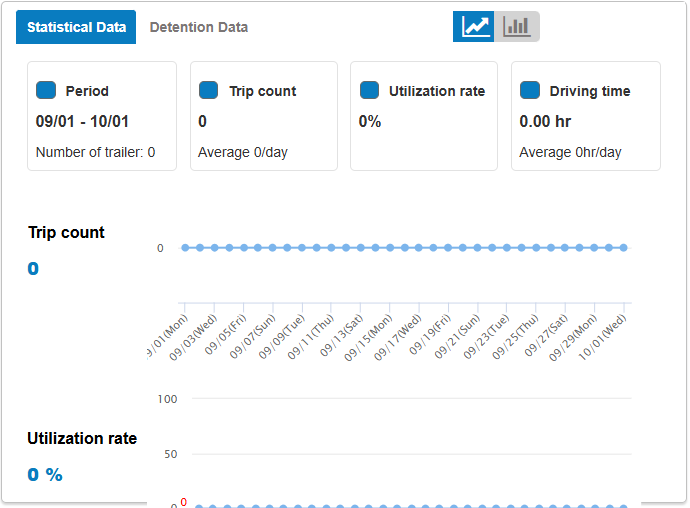
+ The report shows the number of trips, usage rate, and trailer operating time in a graph format.
-
Trailers list:
-
Show trailer list.
-
Select the icon
 to select Arrangement: Ascending Order, Descending Order; Options : Descending/Ascending and Select by Trip count, Utilization rate, Driving time
-
-
Statistical data: The chart includes information about:
-
Period
-
Trip count
-
Utilization
-
Driving time
-
-
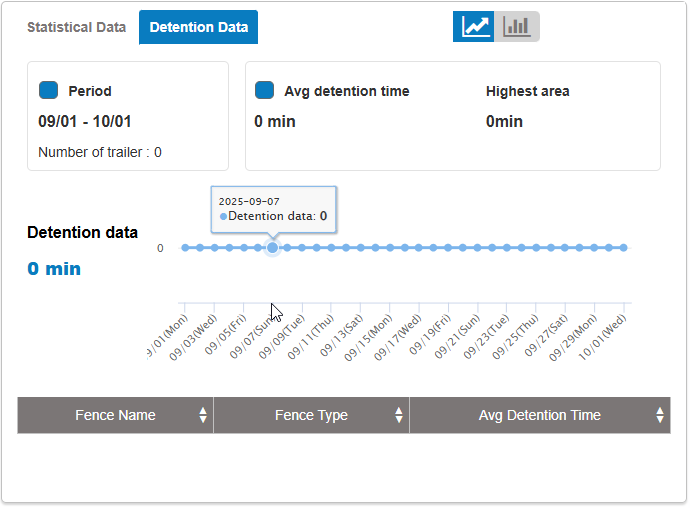
Detention data:
-
Chart: Period, Avg detention time, Highest area
-
Report table: Fence name, Fence type, Avg detention time.
-
-
Select
 to select the chart type
+ Select the icon to download the report as excel/image
- Log in to post comments
- Tiếng Việt
- 繁體中文
Road Speed Limit Report
1. Purpose
- Allows users to count drivers' speed limit violations on specific routes
2. Implementation conditions
- Users are authorized to Road Speed Limit Report on the CRM system
3. Operation
- Go to menu Statistics report/Road Speed Limit Report
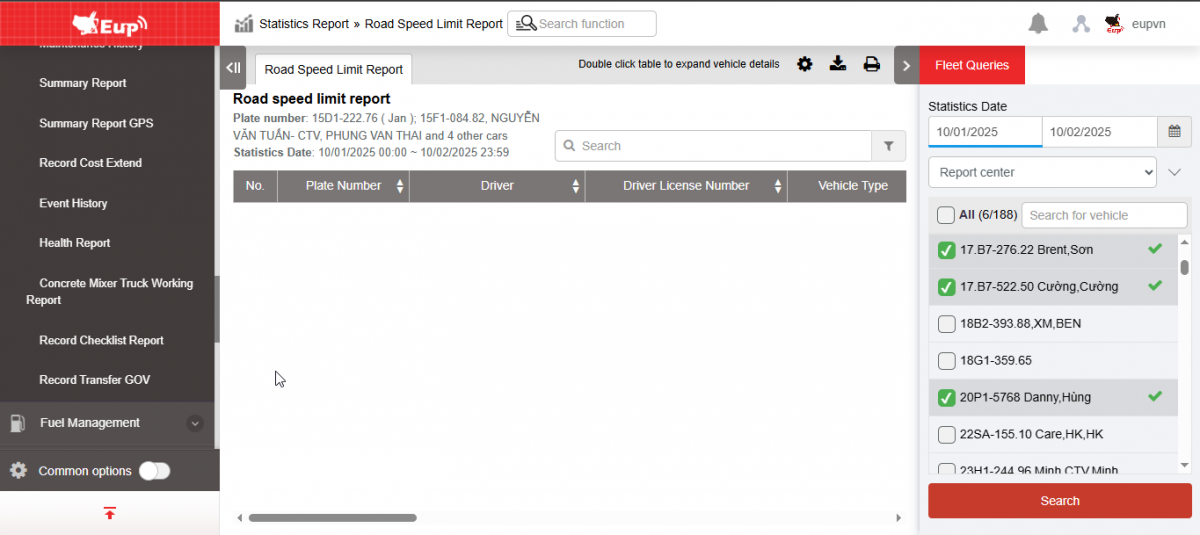
- The function display screen consists of 2 parts:
+ Fleet Queries section for users to select information about time and vehicle list,
+ The Report section displays detailed information about speed, location and time the vehicle exceeded the speed limit.
+ Fleet Queries section : allows users to set up search information as follows:
-
From : Select the first date and time that the user wants to see
-
To : Select the last date and time that the user wants to see
-
Report type : There are 2 types
-
Report center
-
Report by car
-
-
Fleet: Default to the entire fleet and allows selecting other fleets in the system
-
Vehicles: Allows selection of one, multiple or all vehicles using checkbox
-
Country: There are two options Vietnam, Laos. Default is All
-
Click Search to display results
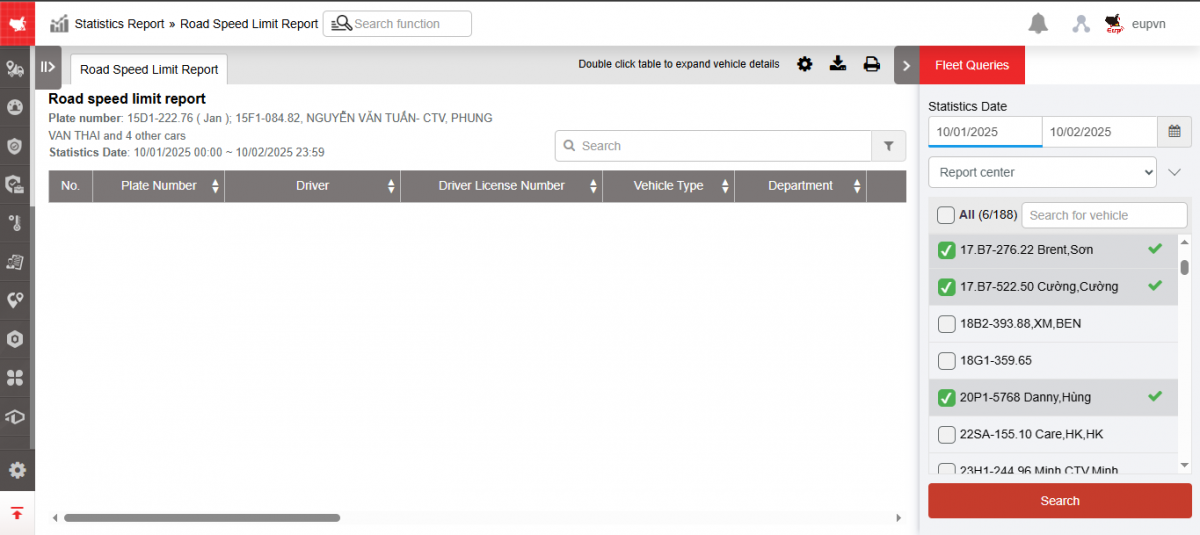
+ Report section : Includes indicators
-
Plate number
-
Driver
-
Driver's license number
-
Vehicle type
-
Department
-
Total violation time: The time the vehicle violated the speed limit
-
Average speed: Vehicle speed at the time of the violation
-
Speed limit: The speed limit is set in the Abnormal settings section.
-
Excess speed: Exceeding the set speed limit
-
Start Coordinates: Coordinates of the vehicle start at the speed violation location
-
End coordinate: Coordinates of the vehicle stop at the speed violation location
-
Address: Address at the time the vehicle exceeded the speed limit
+ Select the icon to print the report
+ Select the icon to download the report in excel format
+ Select icons to customize display columns, customize license plates on reports and set up printing signatures
- Log in to post comments
- Tiếng Việt
- 繁體中文
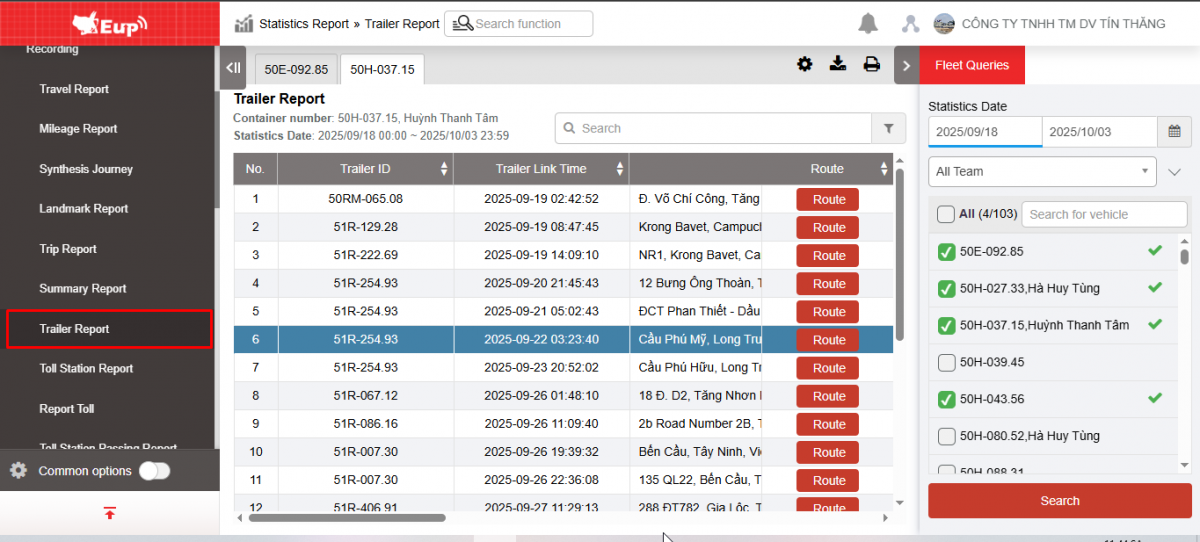
Trailer Report
1. Purpose
- Allows users to check information about trailer connection and disassembly time, connection and disassembly locations, total time the tractor and trailer are assigned together as well as the number of kilometers traveled during the trailer assignment time.
2. Implementation conditions
- Users are authorized to Trailer report on the CRM system.
3. Operation
- Go to the Statistics Report/Trailer report function .
- The function display screen consists of 2 parts:
1. Fleet Queries section for users to select information about time and vehicle list,
2. Trailer Report section displays detailed information about trailer connection and disassembly time, connection and disassembly locations, total time the tractor and trailer are assigned together, as well as the number of kilometers traveled during the trailer assignment time.

+ Fleet Queries section : allows users to set up search information as follows:
-
From : Select the first date and time that the user wants to see
-
To : Select the last date and time that the user wants to see
-
Fleet: Default to the entire fleet and allows selecting other fleets in the system
-
Vehicles: Allows selection of one, multiple or all vehicles using checkbox
-
Click Search to display results
+ Report section : Includes indicators
-
Trailer ID: Trailer License Plate connected to vehicle
-
Trailer Link Time: Time the trailer starts to connect to the vehicle
-
Address: Address to perform Mooc connection
-
Trailer Unlink Time: Time the trailer is removed from the vehicle
-
Address: Address to perform the removal of the trailer
-
Mileage Number of Km the vehicle travels from the time the trailer is attached to the time the trailer is removed
-
Time accumulation
-
Driving time: Total driving time from trailer attachment to trailer disengagement
-
Route: Press the Route button , the system supports displaying the vehicle's travel history

+ Select the icon to print the report
+ Select the icon to download the report in excel format
+ Select icons to customize display columns, customize license plates on reports and set up printing signatures
+ Trailer removal, disconnection, and trailer installation events:
-
If the Trailer signal is sent back for more than 15 minutes and the customer only uses the VN40 option and has not been paired with any previous trailer, the update is that the connection is lost.
-
The signal sent by the trailer is greater than 15 minutes and the customer only uses the VN40 option and was previously paired with the tractor, then the update is the event of removing the trailer.
-
In case the customer uses option VN40A and the tractor signal is sent back <=30 minutes. If the tractor loses signal and was previously attached to a trailer and the distance from the trailer to the tractor is >150m, the Trailer removal event will be updated. If the distance between the tractor and the trailer is <=150m, the tractor is still understood to be attached to the previous vehicle.
-
In case the customer uses VN40A and the tractor signal is sent back >30 minutes and before that the tractor has an event attached to a trailer, check the distance between the tractor and the trailer >150m then update the trailer removal event.
-
In case the tractor signal is sent back <30p and there is a signal, at the same time check the Trailer signal, if the Trailer has a signal, the distance between the tractor and the Trailer is <500m, the time difference between the signal sent between the tractor and the Trailer is <30p, the speed difference between the Trailer and the tractor is <20km/h then the tractor and the Trailer have the same pairing information, update the Trailer installation event. Or if there is no information in the pairing table, select the Trailer closest to the tractor to update the Trailer installation event.
- Log in to post comments
- Tiếng Việt
- 繁體中文
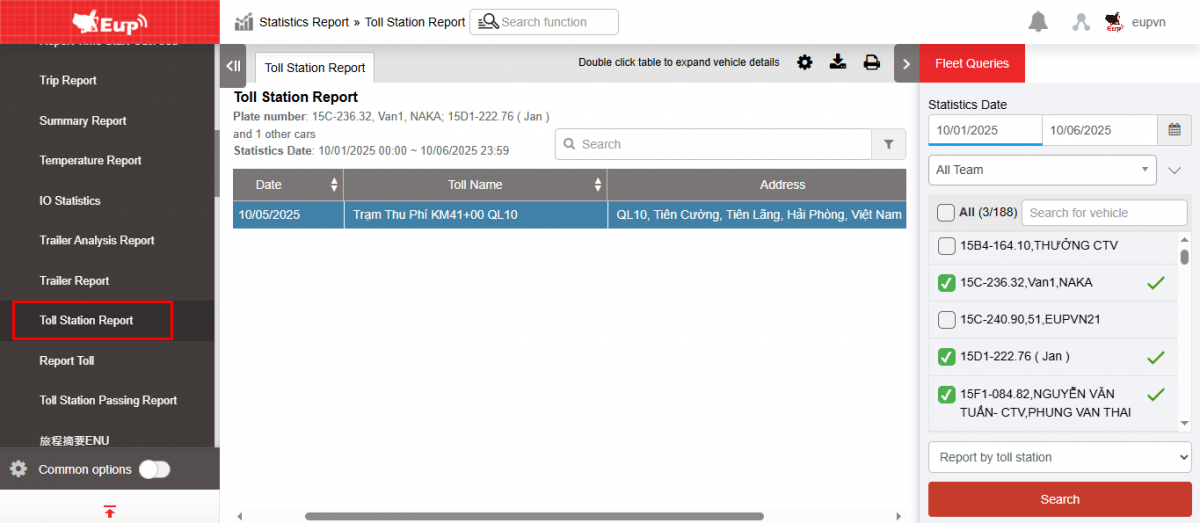
Toll Station Report
1. Purpose
- Allows users to count the number of times vehicles pass through toll stations within a certain period of time.
2. Implementation conditions
- Users are authorized to Toll Station Report on the CRM system.
3. Implementation instructions
- Go to the menu Statistics report/ Toll Station Report
- The function display screen consists of 2 parts:
1. The Fleet Queries section allows users to select information about time and vehicles for statistical reporting;
2. The Toll Station Report section allows displaying statistics on the number of times the toll station enters and exits.
+ Fleet queries section : allows users to set up search information as follows:
-
From : Select the first date and time that the user wants to see
-
To : Select the last date and time that the user wants to see
-
Fleet: Default to the entire fleet and allows selecting other fleets in the system
-
Vehicles: Allows selection of one, multiple or all vehicles using checkbox
-
Report Type: Allows selection of one of two types:
-
Report by toll station
-
Report by car
-
-
Click Search to display results
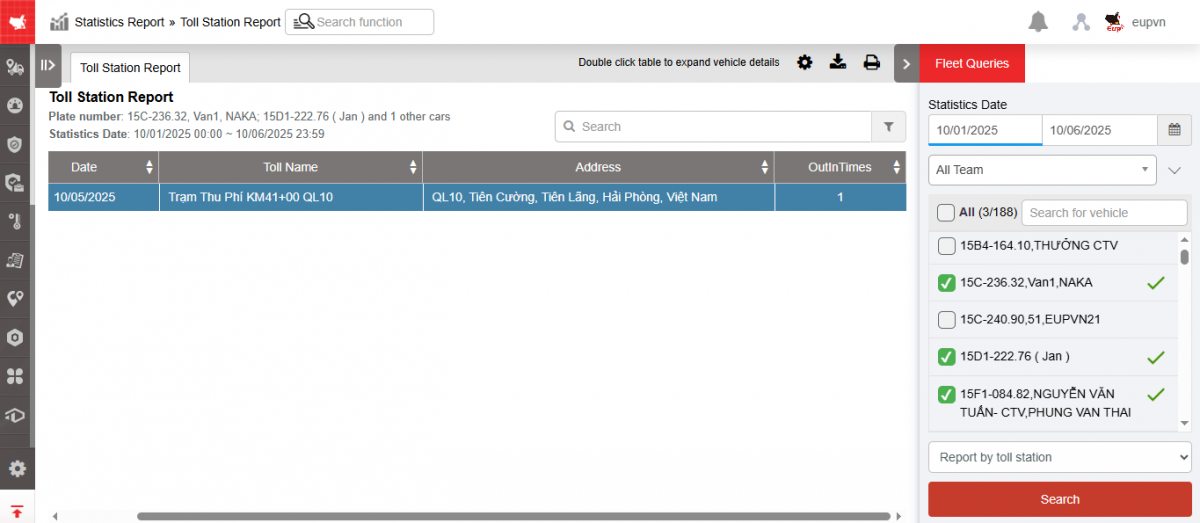
+ The Toll Station Report section displays the toll station report with the following information:
-
Date: Date the vehicle enters and exits the toll station
-
Toll name
-
Address: Toll station address
-
Out in time: Statistics of the number of times vehicles pass through the toll station per day
* Douple click to the line to view the details:
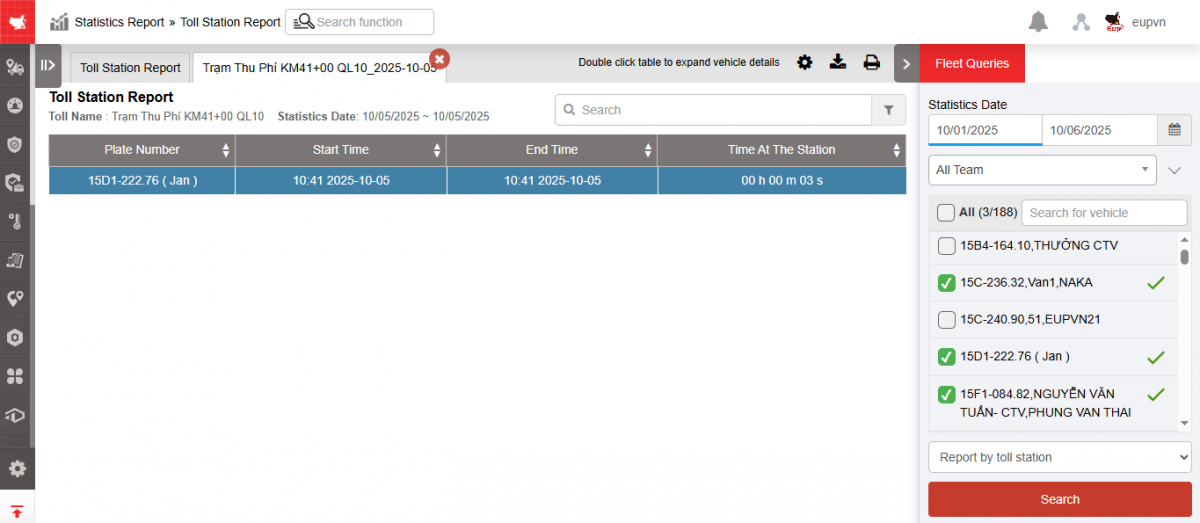
+ Select the icon to print the report
+ Select the icon to download the report in excel format
+ Select icons to customize display columns, customize license plates on reports and set up printing signatures
- Log in to post comments
- Tiếng Việt
- 繁體中文
Report toll
1. Purpose
- Allows users to calculate road and bridge costs by day and by vehicle within a certain period of time.
2. Implementation conditions
- Users are authorized to Report toll on the CRM system.
3. Implementation instructions
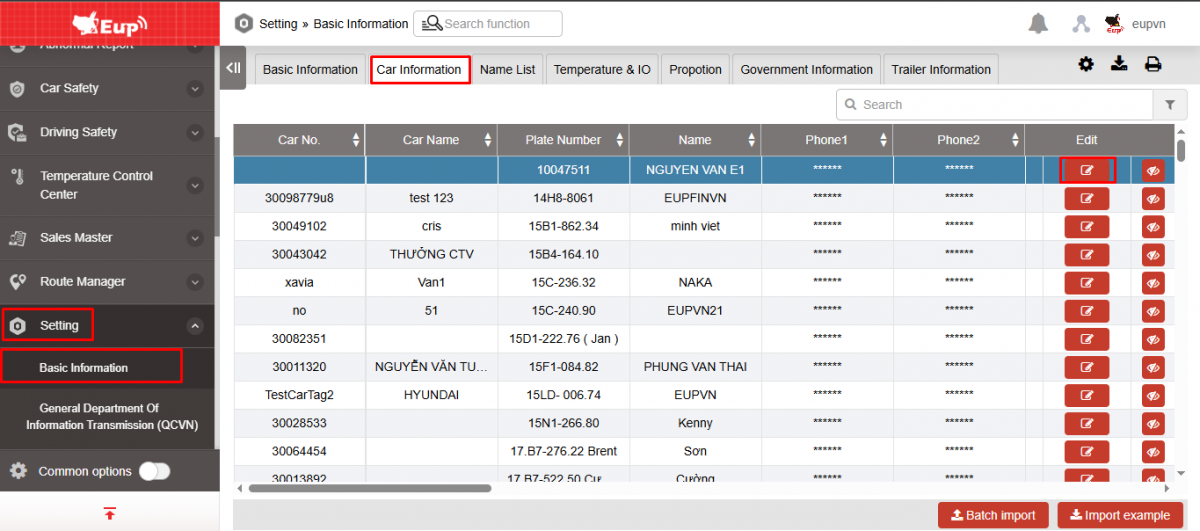
- To display road tolls, it is necessary to set the vehicle type passing through the toll station. To set up, the user does the following:
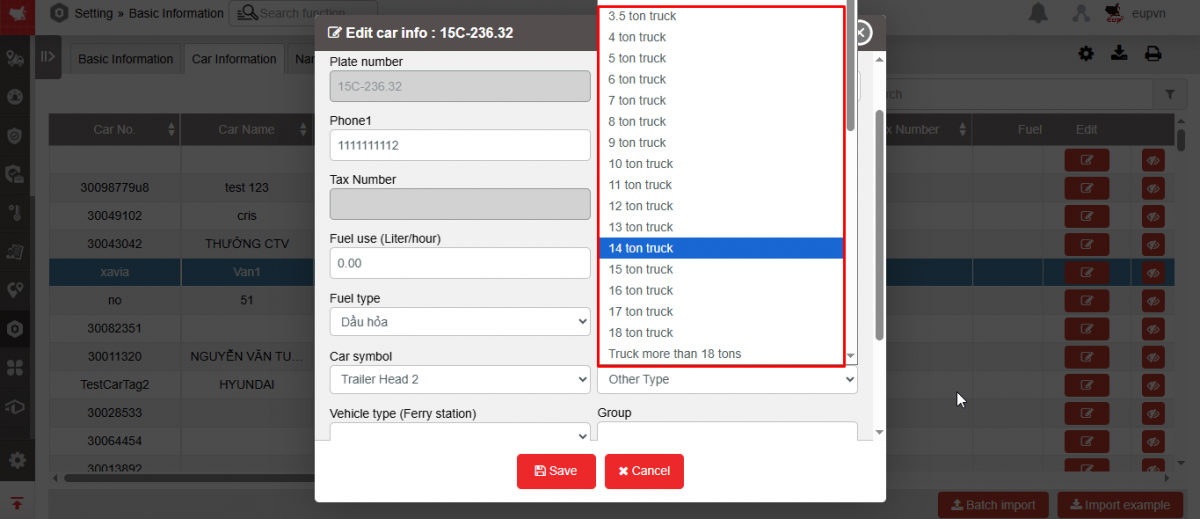
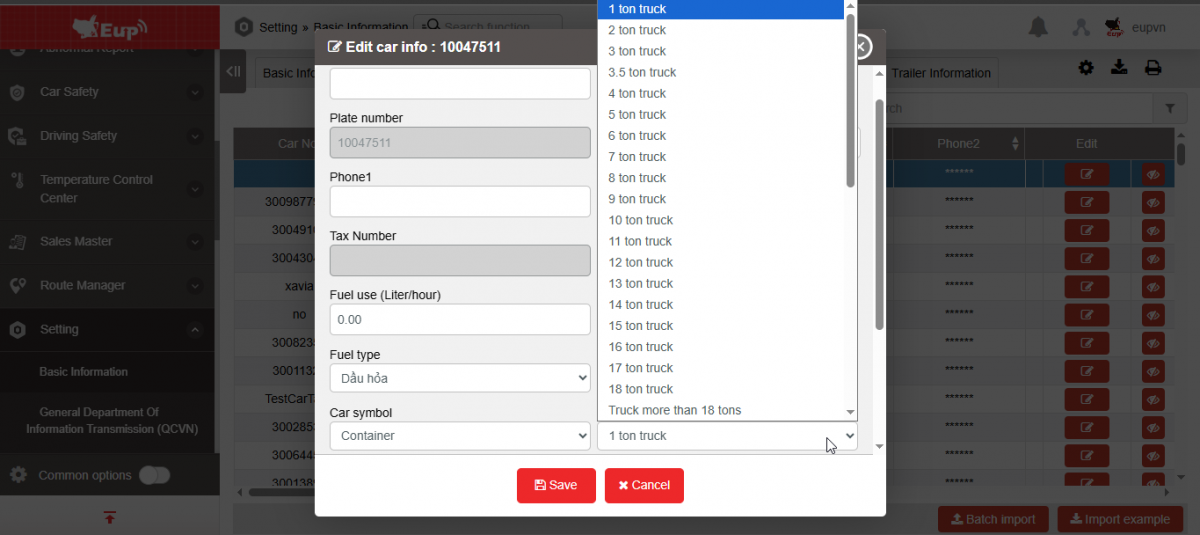
1. Go to the Settings/Basic Information menu , in the Car Information tab , select the license plate number you want to set up and press the Edit button .
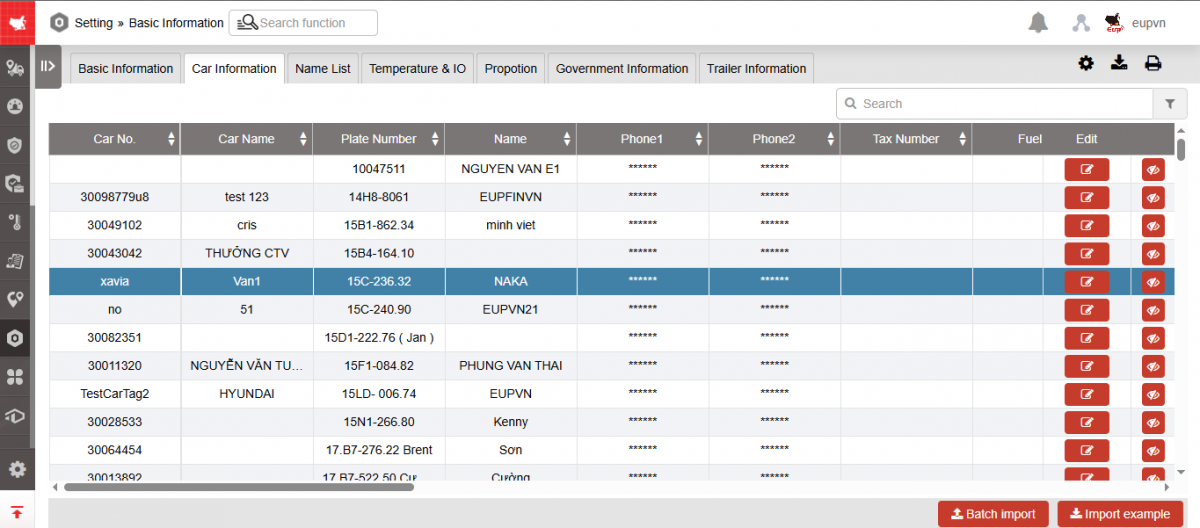
2. Display Edit Car Information screen, go to the Vehicle Type (Toll Station/Maximum Speed Config) field and select the corresponding vehicle type, then Save the settings information
- To view the report, go to the menu Statistics report/Report toll
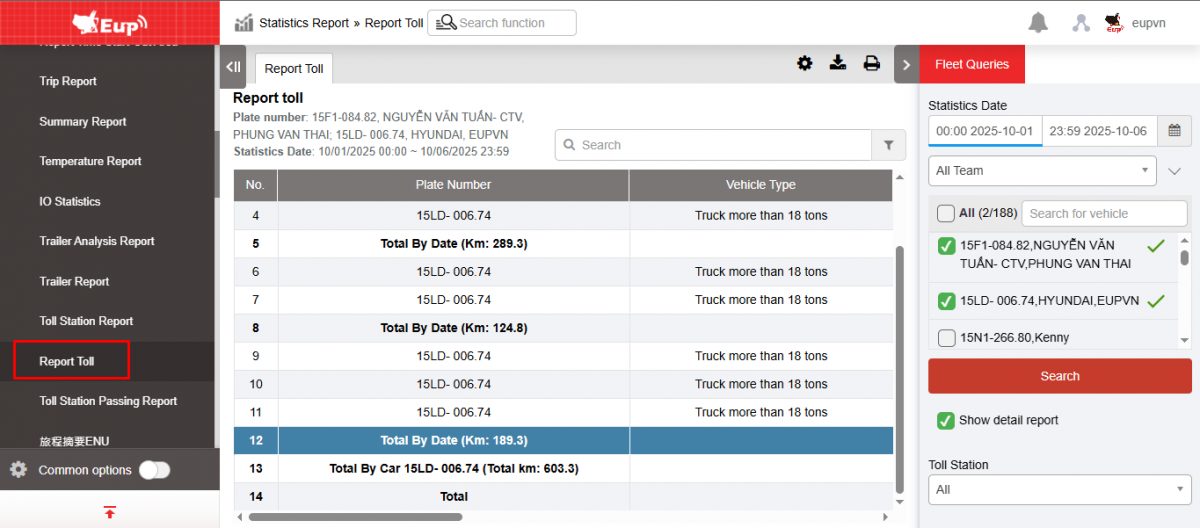
- The function display screen consists of 2 parts:
+ The Fleet Queries section allows users to select information about time and vehicles for statistical reporting;
+ The Report toll section allows displaying statistics on the time of entering the toll station, the time of leaving the toll station, and the cost of passing through the toll station.
+ Fleet Queries section : allows users to set up search information as follows:
-
From : Select the first date and time that the user wants to see
-
To : Select the last date and time that the user wants to see
-
Fleet: Default to the entire fleet and allows selecting other fleets in the system (already set in Settings/Permissions)
-
Vehicles: Allows selection of one, multiple or all vehicles using checkbox
-
Click Search to display results
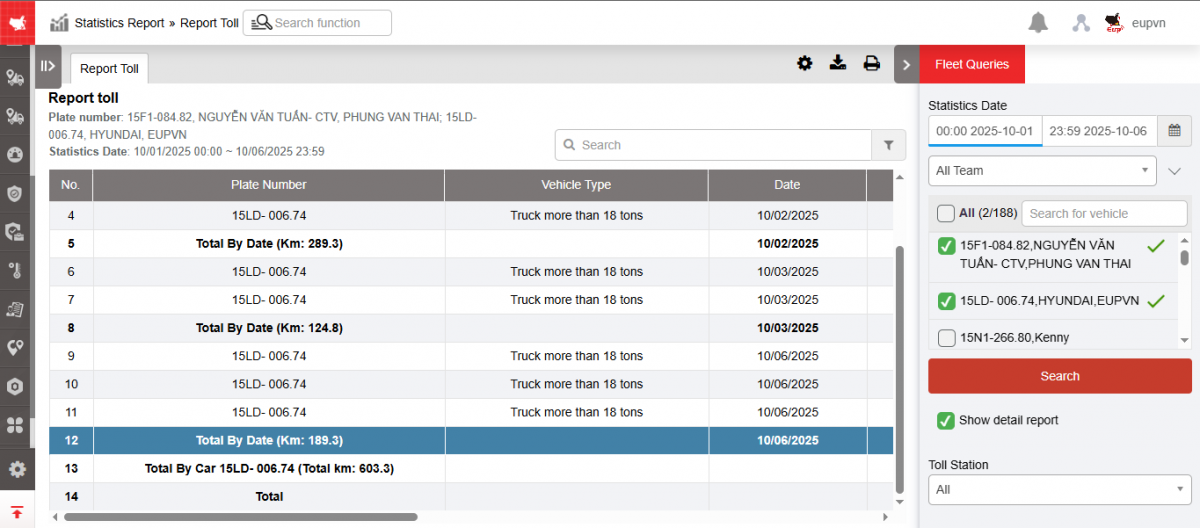
+ The Report Toll section displays information including:
-
Date : Date the vehicle enters and exits the toll station
-
Start time : Time when the vehicle begins entering the toll station
-
Start/End toll station: Toll station name
-
End time : Time the vehicle leaves the toll station
-
Cost : Amount to be paid when passing through the toll station
-
Total by date : Displays the number of kilometers per day during the search period and the total toll costs incurred per day for each vehicle
-
Total by car: Displays the number of kilometers by vehicle during the search period and the total road and bridge costs incurred by vehicle for all days within the search period.
-
Note: For stations that have not been configured for cost, there will be a note Price Not Determined
+ Select the icon to print the report
+ Select the icon to download the report in excel format
+ Select icons to customize display columns, customize license plates on reports and set up printing signatures
- Log in to post comments
- Tiếng Việt
- 繁體中文
Toll Station Passing Report
1. Purpose
- Allows users to count road and bridge costs by day, by vehicle, and total amount, total kilometers, and number of times passing through the station during the search period.
2. Implementation conditions
Report through toll stationToll Station Passing Report on CRM system
3. Implementation instructions
- To display road tolls, it is necessary to set the vehicle type passing through the toll station. To set up, the user does the following:
1. Go to menu
2. Display the Edit Vehicle Information screen , go to the Vehicle Type (Toll Station/Maximum Speed Management) field and select the corresponding vehicle type, then Save the settings information
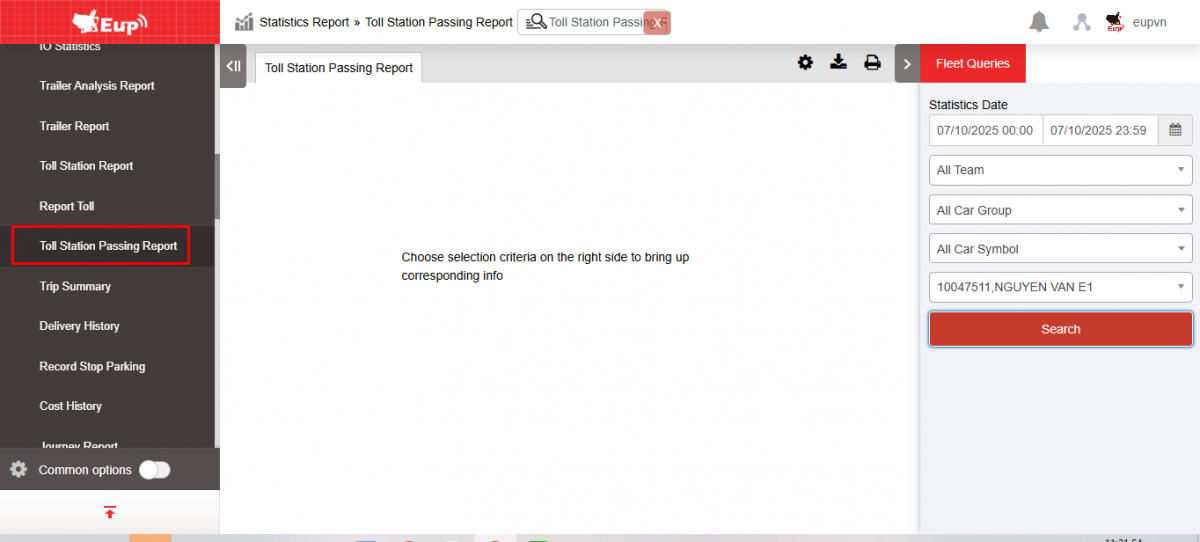
- To view the report, go to the menu Search statistics/ Road toll report:
1. Go to the Search Statistics/Report via toll station menu
2. The function display screen consists of 2 parts:
+ The Fleet Information section allows users to select information about time and vehicles for statistical reporting;
+ The Toll Station Passing Report section allows displaying statistics on the time to enter the toll station, the time to leave the toll station, the cost to pass the toll station, the total cost to pass the station, the total number of times to pass the station, and the total number of kilometers during the search period.

+ Fleet Information section : allows users to set up search information as follows:
-
From : Select the first date and time that the user wants to see
-
To : Select the last date and time that the user wants to see
-
Fleet: Default to the entire fleet and allows selecting other fleets in the system
-
Vehicle: Allows selecting vehicles using checkbox
-
Click Search to display results
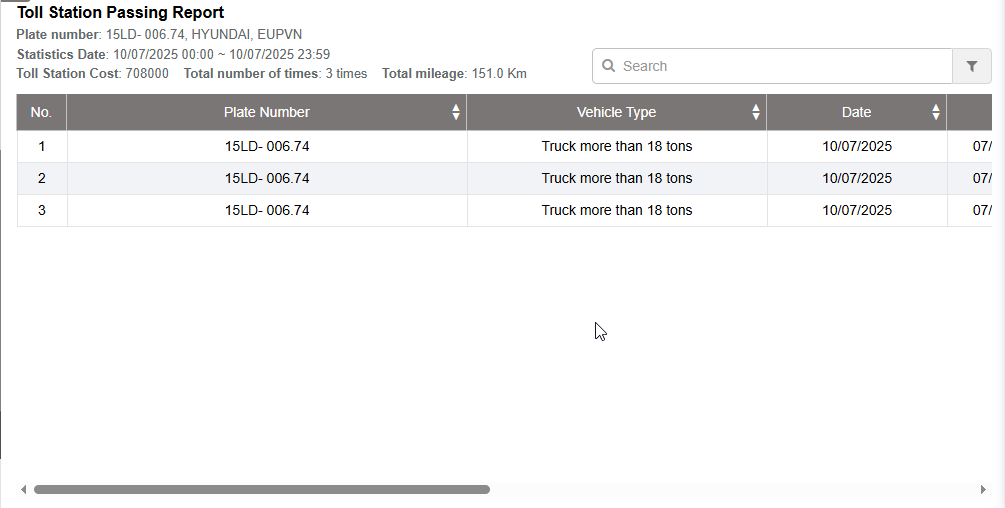
+ The Toll Station Passing Report section displays information in 3 parts:
Part 1:

-
Plate number: License plate
-
Toll Station Cost: Total fare through station during search period
-
Total number of times: Total number of times entering and exiting the station
-
Total mileage: Total km of the vehicle during the search period (Including total km during the period when the vehicle did not pass through the station)
Part 2 :
-
Date : Date the vehicle enters and exits the toll station
-
Vehicle type: Date and time of report lookup
-
Start time : Time when the vehicle begins entering the toll station
-
Start/End Toll Station: Toll station name
-
End time : Time the vehicle leaves the toll station
-
Cost : Amount to be paid when passing through the toll station
-
Note : For stations that have not been configured for cost, there will be a note Price Not Determined
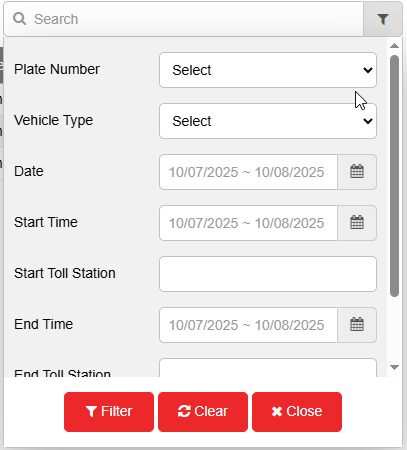
Part 3: Select the Filter function  to filter the data you want to view:
+ Select the icon to print the report
+ Select the icon to download the report in excel format
+ Select icons to customize display columns, customize license plates on reports and set up printing signatures
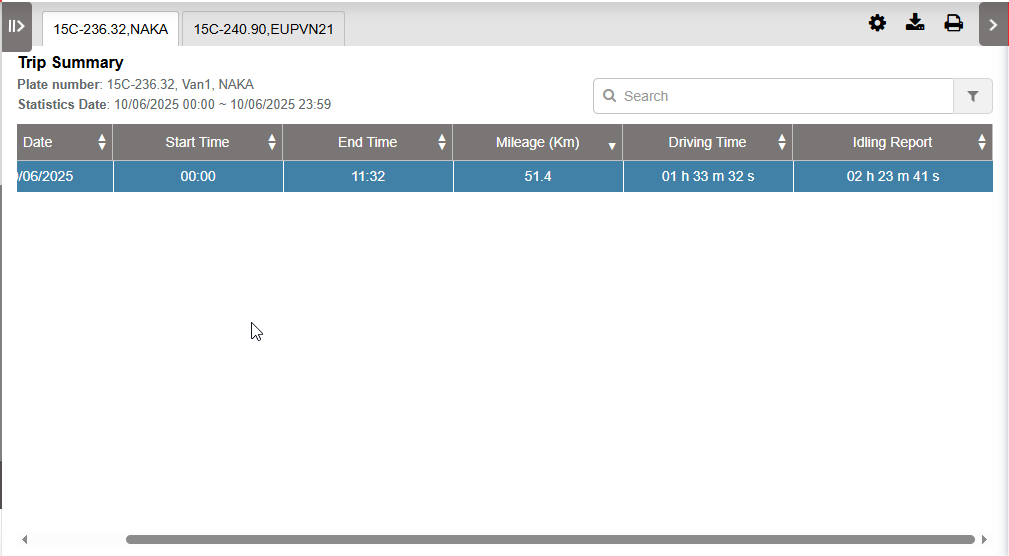
Trip Summary
1. Purpose
- Allows users to summarize activities on total kilometers, operating time, and vehicle stops without turning off the engine within a certain period of time.
2. Implementation conditions
- Users are authorized to summarize the journey on the CRM system.
3. Implementation instructions
1. Go to the Search Statistics/ Trip Summary menu
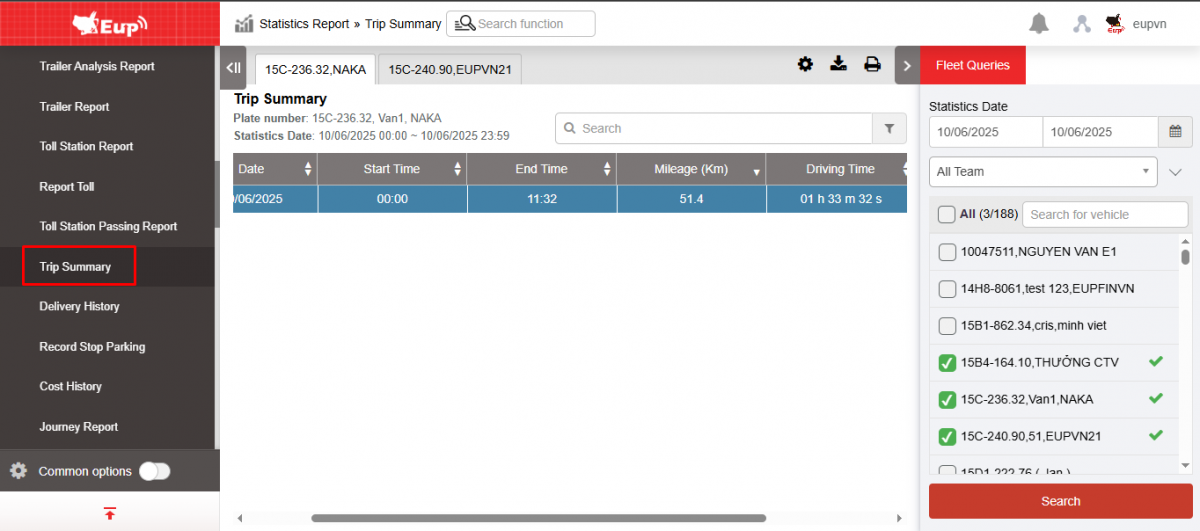
2. The function display screen consists of 2 parts:
+ The Fleet Queries section allows users to select information about time and vehicles for statistical reporting;
+ The Trip Summary section allows displaying statistics on the start time, end time, number of kilometers, operating time, and vehicle stopping time without turning off the engine during the lookup period.
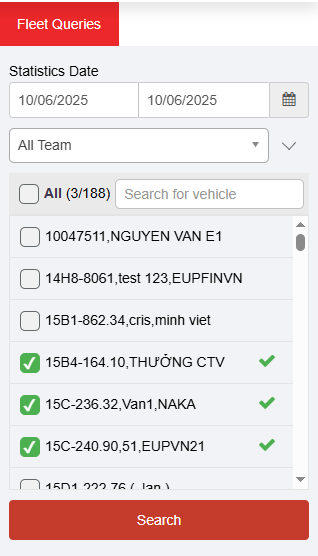
+ Fleet Queries section : allows users to set up search information as follows:
-
From : Select the first date and time that the user wants to see
-
To : Select the last date and time that the user wants to see
-
Fleet: Default to the entire fleet and allows selecting other fleets in the system
-
Vehicles: Allows selection of one, multiple or all vehicles using checkbox
-
Click Search to display results
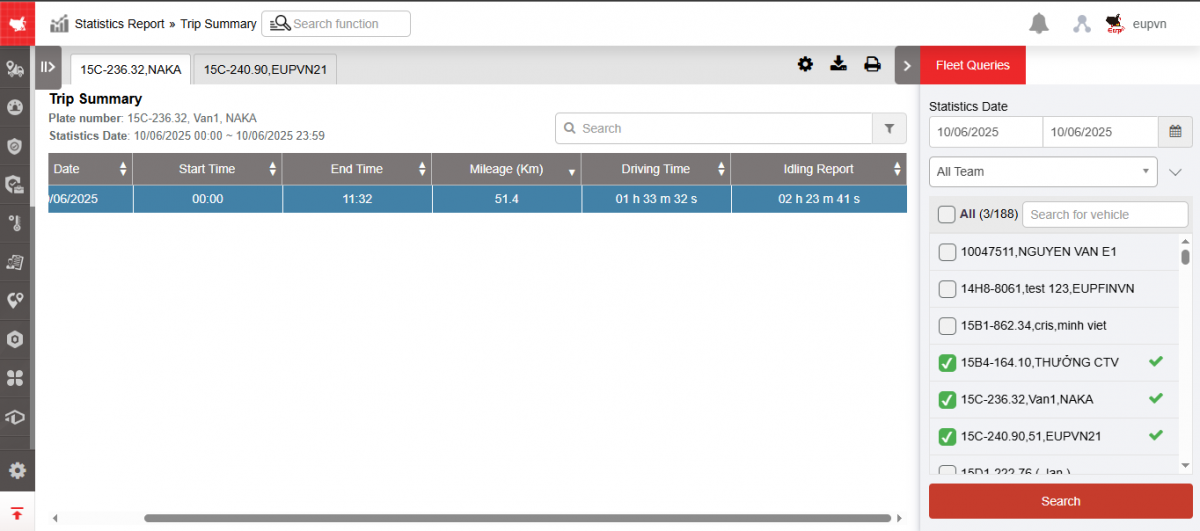
+ The Trip Summary section displays information including:
-
STT
-
Date
-
Start Time : Time the vehicle starts operating
-
End Time : The time the vehicle ends its operation
-
Mileage (km): Number of kilometers traveled during the period of operation
-
Driving time: Vehicle running time
-
Idling report
+ Select the icon to print the report
+ Select the icon to download the report in excel format
+ Select icons to customize display columns, customize license plates on reports and set up printing signatures
- Log in to post comments
- Tiếng Việt
- 繁體中文
Delivery history
1. Purpose
- Allows users to count vehicles violating parking time limits when delivering goods
2. Implementation conditions
- Users are authorized to view delivery history on the CRM system.
3. Implementation instructions
- Go to menu Statistics report/ Delivery history
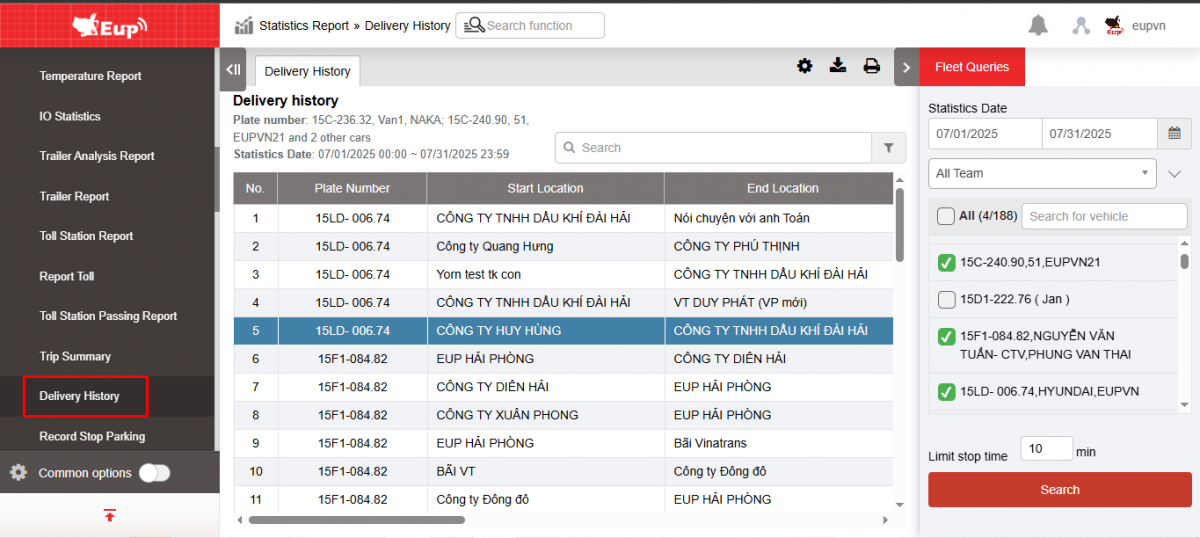
- The function display screen consists of 2 parts:
+ The Fleet Queries section allows setting up criteria for time, vehicle, and limited parking time;
+ Delivery History section displays a list of vehicles that violated parking time.
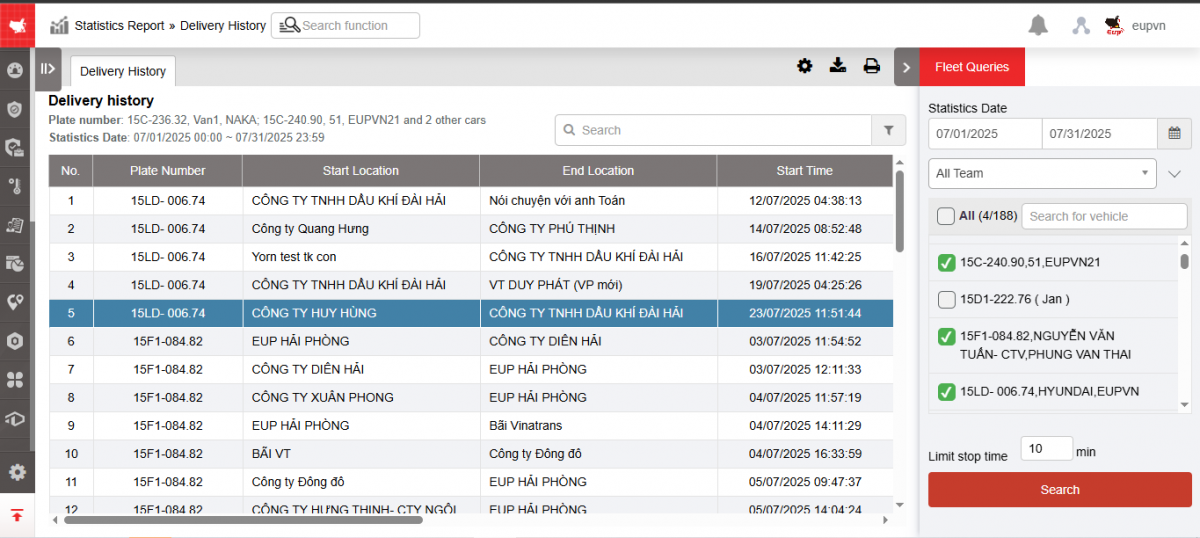
+ Fleet Information section : User selects the following information:
-
From : The first day the user wants to check the delivery history
-
To : Last date the user wants to check the delivery history
-
Entire fleet: Default, and allows selection to individual fleets
-
Vehicle list : You can select all or a specific vehicle.
-
Limited parking time: Allows user to set parking limit of 1 vehicle, the display result will show vehicles with parking time greater than the limited parking time
-
Click Search to display information
+ The Delivery History section displays information including:
-
Plate number
-
Start Time: The time the vehicle begins moving at the starting position
-
End time : Time the vehicle arrives at the end location
-
Start location: The milestone where the vehicle starts moving
-
End location: The milestone where the vehicle ends its move
-
Driving time : Time taken by the vehicle (in running condition) from the starting position to the ending position
-
Time at the station : Time of vehicle stopping, displays vehicles whose time in station exceeds the limited stopping time
-
Total mileage: Distance from starting point to ending point
-
Toll station: List of toll stations a trip has passed through
-
Counts of in and out: Number of times a vehicle enters and exits a toll station
-
Cost: Cost to pay when passing through toll station
+ Select the icon to print the report
+ Select the icon to download the report in excel format
+ Select icons to customize display columns, customize license plates on reports and set up printing signatures
- Log in to post comments
- Tiếng Việt
- 繁體中文
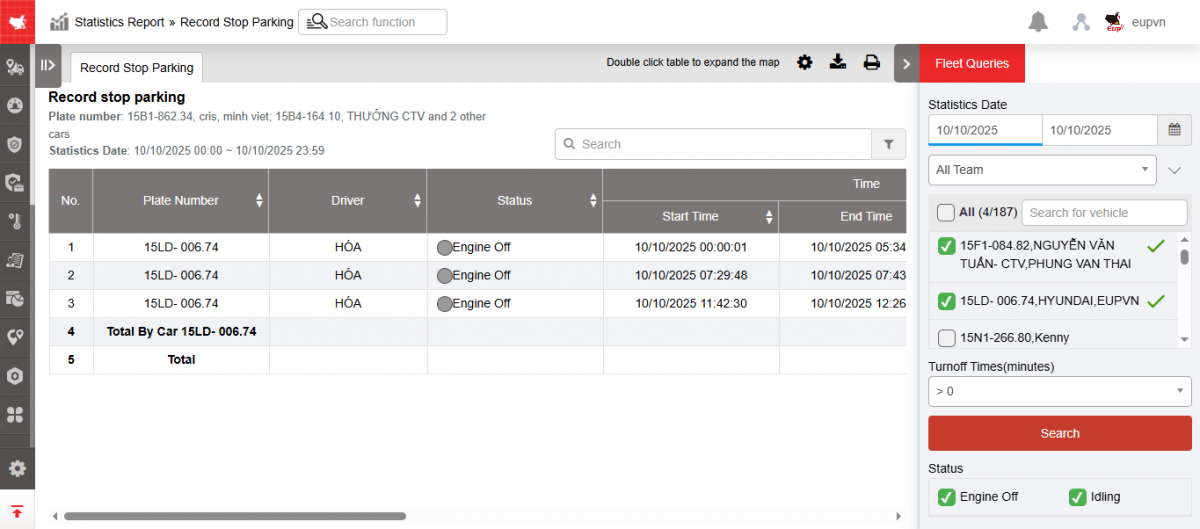
Record stop parking
1. Purpose
- Support users to create driver parking reports, thereby detecting unusual parking points that are not on the vehicle's route.
2. Implementation conditions
- Decentralized usersRecord stop parking
in the system's Authorization function.
3. Implementation instructions
- Go to the Statistic report/ Record stop parking function

- The function display screen consists of 2 parts:
+ The Fleet queries section allows users to set up time parameters and vehicles to view reports;
+ The Record stop parking section displays information about the vehicle's stops.
+ Fleet queries section : To view the report, users select the following information:
-
From: User enters the first date to create the report;
-
To: User selects the last date to create the report;
-
Select the icon
 to select a fleet;
 -
Vehicle: User ticks the checkbox to select the vehicle in the report;
-
Turnoff Times(minutes): Select parking time >...minutes
-
Click Search to display the report in the Record stop parking section
-
Status: Checkbox selected
-
Engine Off
-
Idling
-
+Record stop parking section : Allows users to view all detailed information about the vehicle's parking number, specifically:
-
Plate number;
-
Driver;
-
Status;
-
Time:
-
Start time: Start time of stopping;
-
End time: End time of parking;
-
Total time(Minute) : Total stopping time (in minutes);
-
-
Address: Location where the vehicle is parked;
-
Coordinates: Coordinates where the vehicle stops;
+ Select the icon to print the report
+ Select the icon to download the report in excel format
+ Select icons to customize display columns, customize license plates on reports and set up printing signatures
- Log in to post comments
- Tiếng Việt
- 繁體中文
báo cáo phát thải CO2 (báo cáo này đã ẩn không dùng)
1. Mục đích
- Hỗ trợ NSD lập kiểm tra báo cáo lượng CO2 phát thải
2. Điều kiện thực hiện
- NSD được phân quyền Báo Cáo Khí Thải CO2 tại chức năng Phân quyền của hệ thống.
3. Hướng dẫn thực hiện
- Vào chức năng Tìm kiếm thống kê/ Báo cáo khi thải CO2
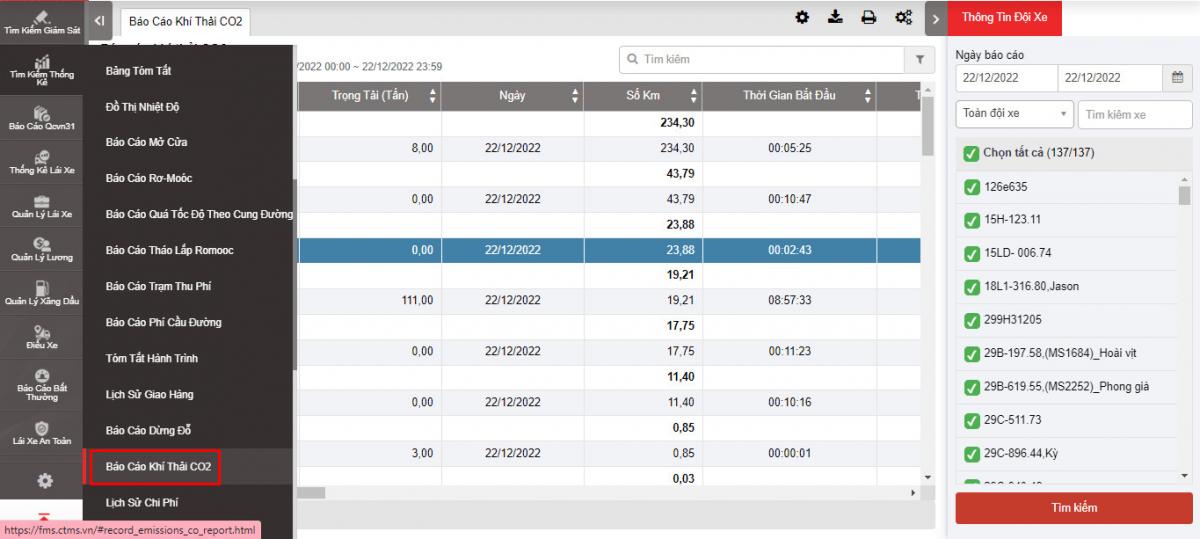
- Màn hình chức năng hiển thị gồm 2 phần:
+ Phần Thông tin đội xe cho phép NSD thiết lập các tham số thời gian, xe cần xem báo cáo;
+ Phần Thông tin chi tiết hiển thị thông tin các điểm dừng của xe.
+ Phần Thông tin đội xe: Để xem báo cáo NSD chọn các thông tin sau:
-
Từ: NSD nhập ngày đầu tiên muốn lập báo cáo;
-
Đến: NSD chọn ngày cuối cùng muốn lập báo cáo;
-
Chọn biểu tượng
để chọn đội xe; -
Tại danh sách xe: NSD tích vào checkbox để chọn xe trong báo cáo;
-
Ấn Tìm kiếm để hiển thị báo cáo tại phần Thông tin chi tiết.

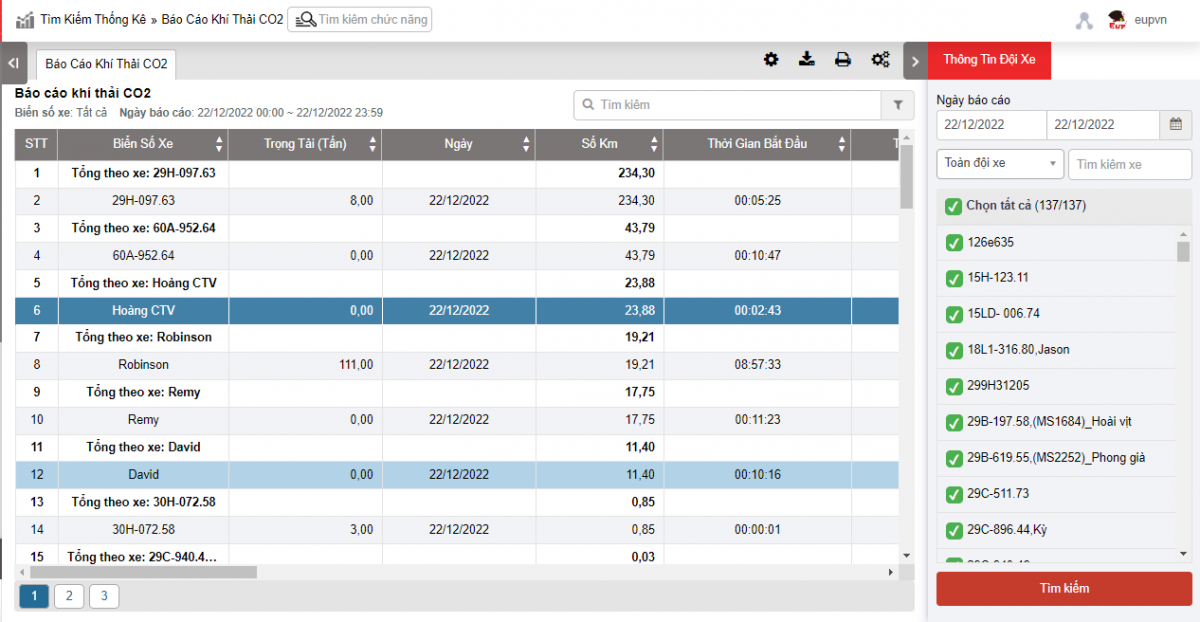
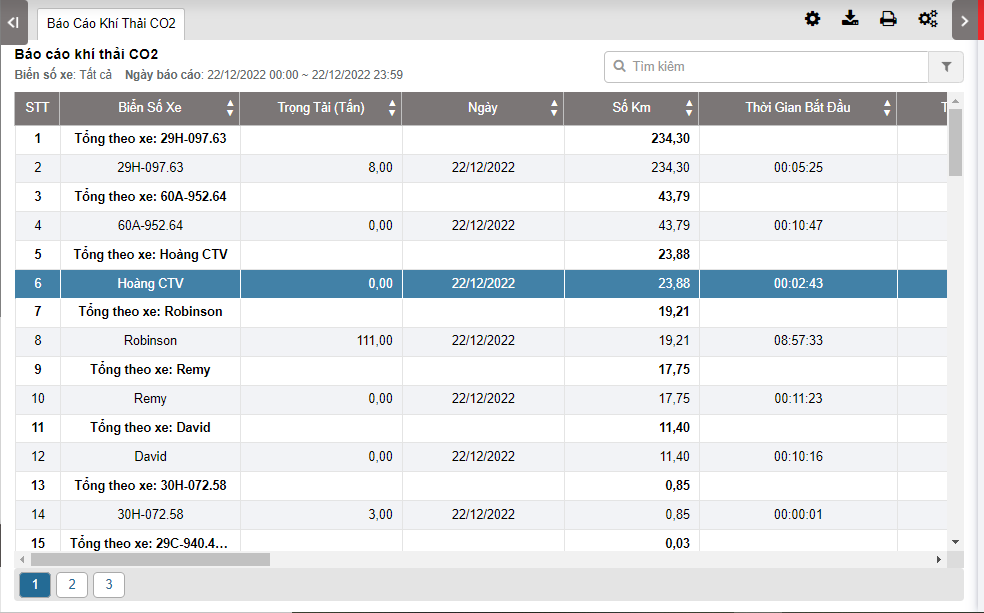
+ Phần Thông tin chi tiết: Cho phép NSD xem được toàn bộ thông tin chi tiết về Báo cáo khí thải CO2, cụ thể:
-
Biển số xe;
-
Trọng tải (Tấn)
-
Ngày
-
Số km
-
Thời gian bắt đầu
-
Thời gian kết thúc
-
Nhiên liệu định mức (km/l)
-
Nhiên liệu định mức (lit/h)
-
Thời gian xe chạy: Tổng thời gian xe hoạt động
-
Nhiên liệu tiêu thụ khi lái xe (Lít): Số lít dầu tiêu thụ khi xe chạy
-
Nhiên liệu tiêu thụ khi dừng xe không tắt máy (Lít): Vận tốc <3 xe vẫn nổ máy thì phát sinh tiêu thụ nhiên liệu và được lấy theo cảm biến dầu
-
Nhiên liệu theo km (Lít): Số lít dầu tiêu thụ tương ứng với số Km xe chạy
-
Số lần dừng xe không tắt máy
-
Giảm tốc đột ngộṭ (lần): Giảm tốc độ đột ngột trong thời gian 1 giây
-
Tăng tốc đột ngột (lần): Tăng tốc độ đột ngột trong thời gian 1 giây
-
Gọi SOS (lần): Số lần nhấn nút SOS
-
Lượng CO2 phát thải (grCo2): Lượng CO2 phát thải= Trọng tải xe* Số KM xe đi đc *Chỉ số phát thải
+ Chọn biểu tượng để in báo cáo
+ Chọn biểu tượng để tải báo cáo dưới dạng excel
+ Chọn biểu tượng để tùy chỉnh cột hiển thị, tùy chỉnh biển số xe trên báo cáo và cài đặt chữ ký in ấn
- Log in to post comments
- Tiếng Việt
- 繁體中文
Cost history
1. Purpose
- Allows users to check the history of costs incurred by each vehicle, fleet or all vehicles in the system within a certain period of time entered in the Setting/Cost Management/Current Cost tab
2. Implementation conditions
- User is authorized to use option VN31
3. Implementation instructions
- Go to menu Statistic report/ Cost history
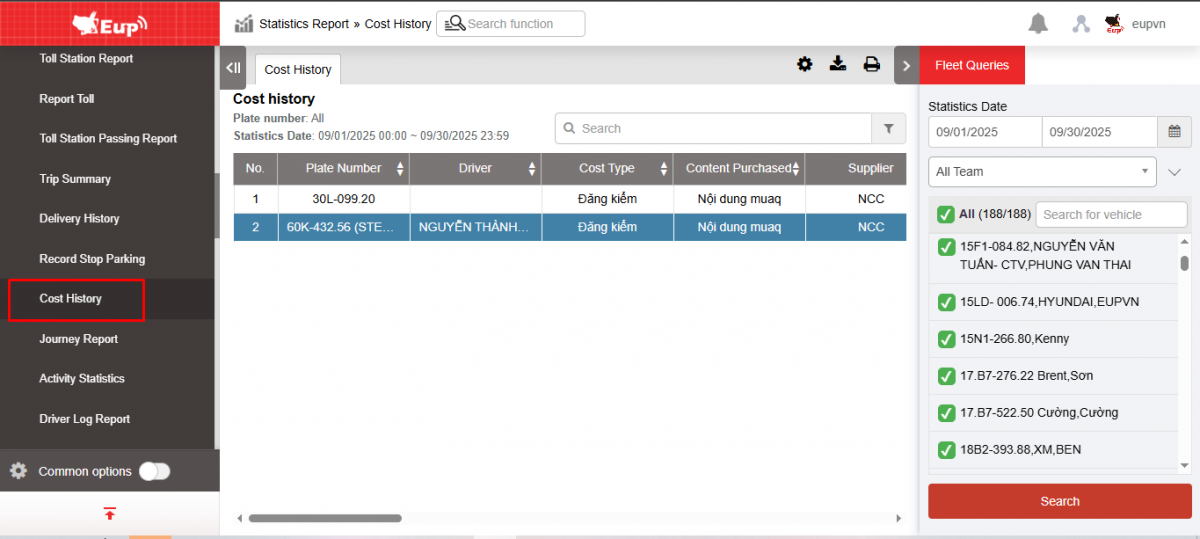
- The function display screen consists of 2 parts:
+ The Fleet Queries section allows users to set up time and vehicle information to check cost history;
+ The Cost History section displays search results according to query parameters.
+ Fleet Queries section : Includes information
-
From, To : User enters the first and last date for which he wants to view the expense history.
-
Fleet : Default is entire fleet, allows selecting vehicles by fleet
-
Vehicle: User selects checkbox to select vehicle to view cost history as desired
-
Search : User selects search to display results
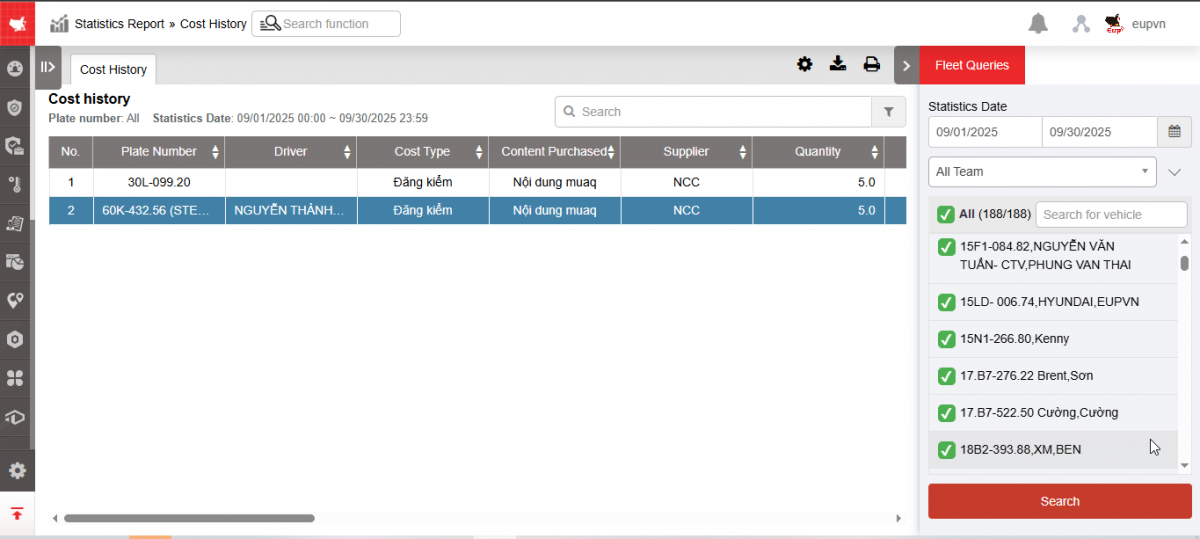
+ The Cost History section displays information including
-
Plate number
-
Driver : Driver's name
-
Cost type
-
Content purchased: Purchase content entered by the user in Settings/Expense management
-
Supplier : The place where the cost incurred that the user entered in Settings/Cost Management
-
Quantity : Number of services generated
-
Unit price : Unit price/ 1 service and additional costs
-
Cost = Quantity * Unit Price
-
Cost date: The date the expense occurred
-
Expiration date
-
Remind Day
-
Start km
-
Norm km
-
Km reminder
-
Remind km
-
Notes
-
Manager
-
Department
-
Toneage
-
Mileage (km)
+ Select the icon to print the report
+ Select the icon to download the report in excel format
+ Select icons to customize display columns, customize license plates on reports and set up printing signatures
- Log in to post comments
- Tiếng Việt
- 繁體中文
Journey report
1. Purpose
- Allows users to check journey reports on driving time, stopping/parking time, engine stopping time, distance, speed, fuel consumption of each vehicle, fleet or all vehicles in the system within a certain period of time.
2. Implementation conditions
- User is authorized to use option VN38
3. Implementation instructions
Step 1: Go to menu Statistics report/Journey report
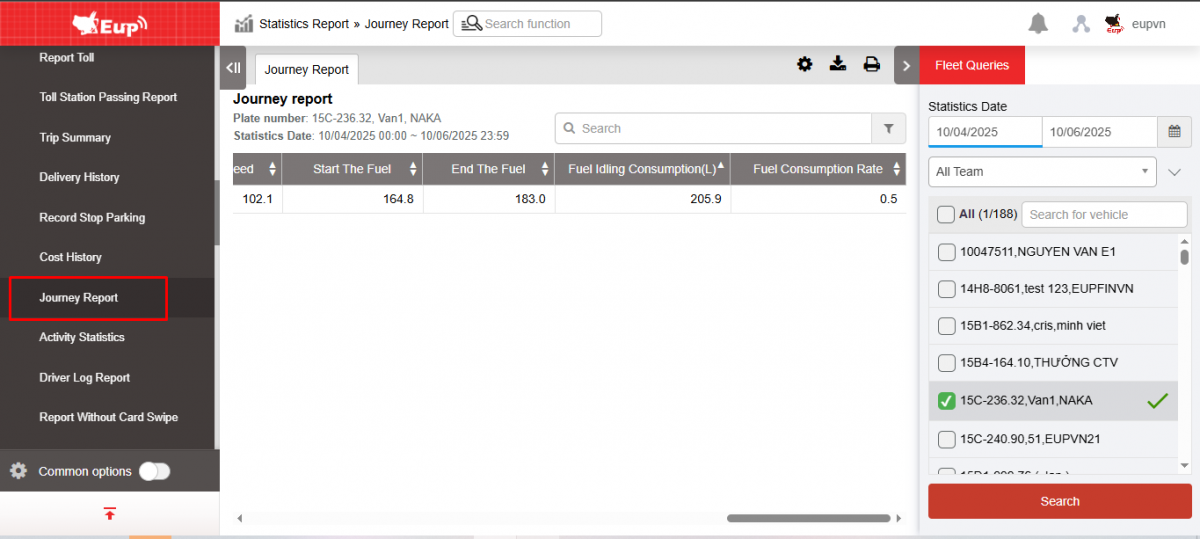
Step 2: The function display screen consists of 2 parts:
+ Fleet Queries section allows users to set up information about time and vehicle to check trip reports
+ The Journey Report section displays search results according to query parameters.
+ Fleet Queries section : Includes information
-
From, To : User enters the first and last date for which he wants to view the expense history.
-
Fleet : Default is entire fleet, allows selecting vehicles by fleet
-
Vehicle: User selects checkbox to select vehicle to view cost history as desired
-
Search : User selects search to display results
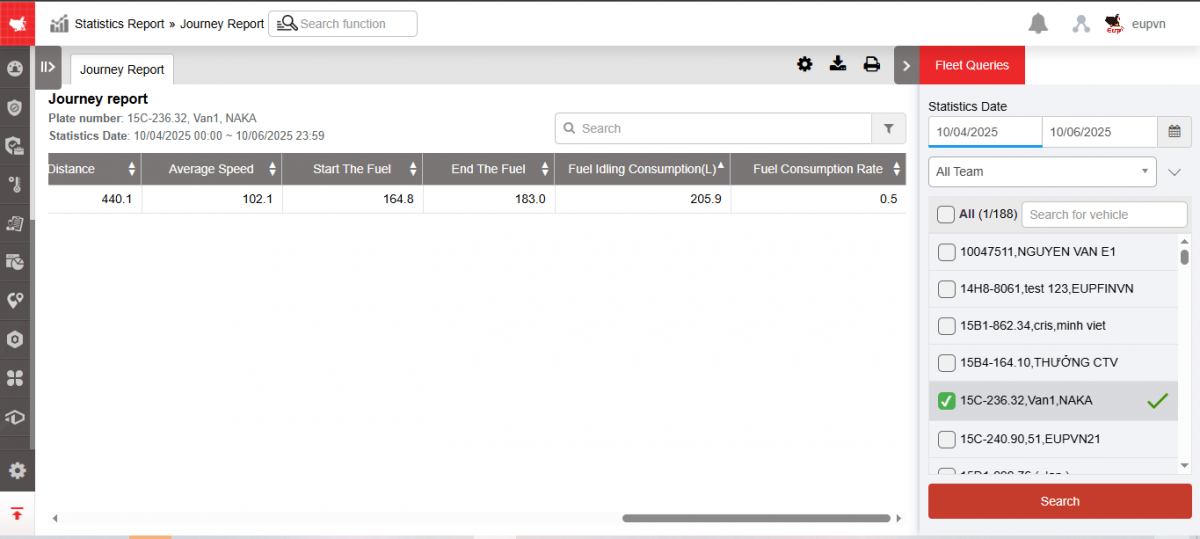
+ The Journey Report section displays information including:
-
late number
-
Start: Starting position
-
End: End position
-
Start point: The time the vehicle begins moving at the starting position
-
End point: Time the vehicle arrives at the end location
-
Time accumulation Total operating time
-
Driving time: Time taken by the vehicle to travel from start position to end position
-
Stop Time: Time the vehicle stops at the place with the key turned off
-
Idling Time the car stops in place with the key on and the engine running
-
Distance: Distance traveled from starting position to ending position
-
Average speed: Average speed of the vehicle from start to finish point
-
Start the fuel: Number of liters of oil at the beginning of the day
-
End the fuel: Number of liters of oil at the end of the day
-
Fuel idling consumption: Number of liters of oil consumed = Final fuel - Initial fuel
-
Fuel consumption rate: L/km rate
+ Select the icon to print the report
+ Select the icon to download the report in excel format
+ Select icons to customize display columns, customize license plates on reports and set up printing signatures
- Log in to post comments
- Tiếng Việt
- 繁體中文
Tổng hợp hoạt động
1. Mục đích
- Cho phép NSD tổng hợp được hoạt động của xe về Số km, Thời gian dùng xe, Thời gian HĐ, Thời gian dừng không tắt máy, Thời gian quá tốc độ, Thời gian đỗ theo từng ngày trong khoảng thời gian tìm kiếm
2. Điều kiện thực hiện
- NSD được phân quyền chức năng Tổng hợp hoạt động
3. Hướng dẫn thực hiện
Bước 1: Vào menu Tìm kiếm thống kê/ Tổng hợp hoạt động
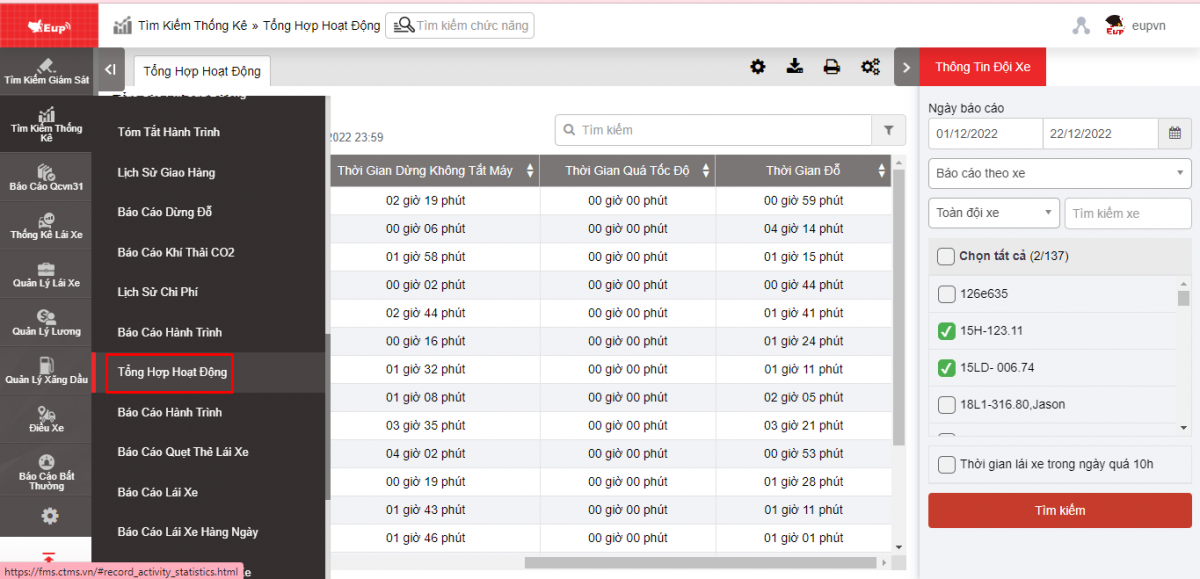
Bước 2: Màn hình chức năng hiển thị gồm 2 phần:
+ Phần Thông tin đội xe cho phép NSD thiết lập các thông tin để hiển thị báo cáo;
+ Phần Tổng hợp hoạt động hiển thị chi tiết các chỉ tiêu báo cáo theo tham số truy vấn. NSD có thể in, kết xuất file báo cáo và cài đặt chữ ký in ấn
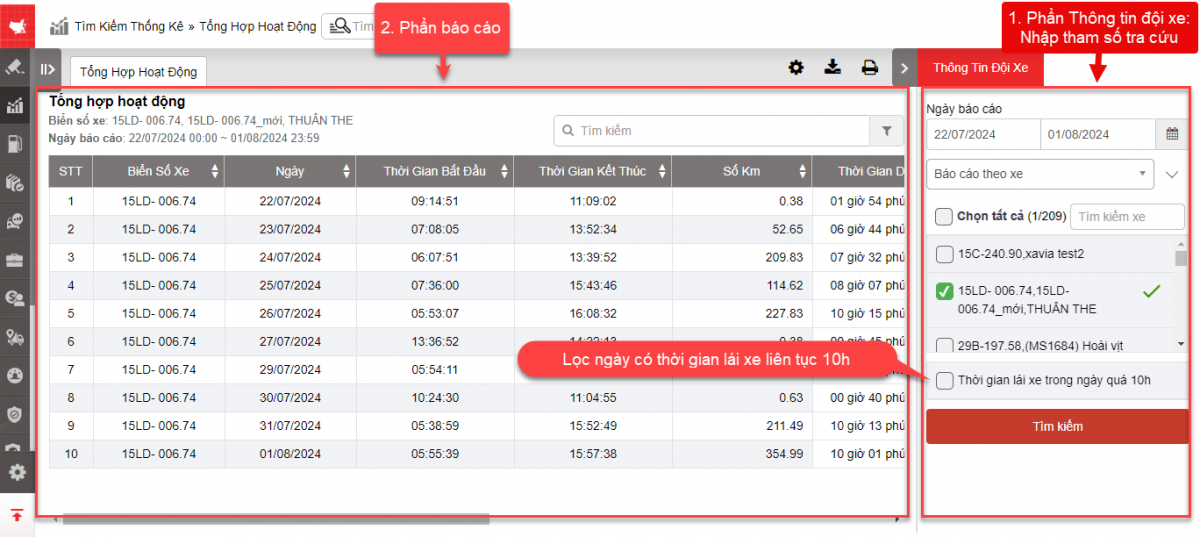
+ Phần Thông tin đội xe gồm các thông tin:
-
Từ: Chọn ngày đầu tiên muốn tra cứu báo cáo
-
Đến: Chọn ngày cuối cùng muốn tra cứu báo cáo
-
Toàn đội xe: Mặc định và cho phép chọn đội xe khác có trong hệ thống
-
Xe: NSD có thể chọn 1 hoặc nhiều xe trong đội xe đã chọn bằng cách tích vào ô checkbox
-
Chọn Tìm kiếm để hiển thị kết quả
-
Lọc tìm Thời gian lái xe trong ngày quá 10h
+ Phần Tổng hợp hoạt động hiển thị chi tiết số liệu theo các chỉ tiêu:
-
Biển số xe
-
Ngày: Ngày báo cáo
-
Thời gian bắt đầu: Thời gian xe bắt đầu di chuyển tại vị trí bắt đầu
-
Thời gian kết thúc: Thời gian xe đến vị trí kết thúc
-
Số km: Số km xe di chuyển tư vị trí bắt đầu đến vị trí kết thúc
-
Thời gian dùng xe: Tổng thời gian hoạt động, dừng xe không tắt máy, dừng đỗ
-
Thời gian HĐ: Thời gian xe di chuyển
-
Thời gian dừng không tắt máy: Thời gian xe dừng không tắt chìa khóa
-
Thời gian quá tốc độ: Thời gian xe vượt quá tốc độ
-
Thời gian đỗ: Thời gian xe dừng tại chỗ không mở chìa khóa
+ Chọn biểu tượng để in báo cáo
+ Chọn biểu tượng để tải báo cáo dưới dạng excel
+ Chọn biểu tượng để tùy chỉnh cột hiển thị, tùy chỉnh biển số xe trên báo cáo và cài đặt chữ ký in ấn
- Log in to post comments
- Tiếng Việt
- 繁體中文
Driver log report
1. Purpose
- Allow generating statistics of driver card swipes at the start and end of each trip, by vehicle
2. Implementation conditions
- The customer is assigned option VN58
3. Implementation instructions
- To generate reports, you must upload the driver list to the system under the Name List tab in Settings / Basic Information, and drivers must swipe their driver card to log in and log out.
-To view the report, follow these steps
Step1: Go to the Statistics report/Driver log report
Step2: The display function screen consists of 2 parts:
+ Fleet Information section: allows users to select search parameters
+ Driver log report: Display detailed information of driver's card swipes

+ Fleet Information Section: User can choose as follows
-
From: Select the first day you want to look up the report
-
To: Select the last day you want to look up the report
-
Team: Default is All fleet. Select the icon
 to select the fleetg
 -
Vehicle: User selects the checkbox to select the vehicle to view
-
Click Search to display the search results
+ Phần Báo cáo quẹt thẻ lái xe: Gồm các thông tin
-
Vehicle: The license plate number of the vehicle that the driver will be driving when he starts swiping the card
-
Driver name
-
Driver's license number
-
Start Time: The time the driver starts swiping the card when he or she begins taking charge of the vehicle
-
End Time: The time the driver swipes the card after completing the assigned trip
+ Select the icon to print the report
+ Select the icon to download the report as excel
+ Select the icon to Custom Field, Plate number field settings, Print signature settings
- Log in to post comments
- Tiếng Việt
- 繁體中文
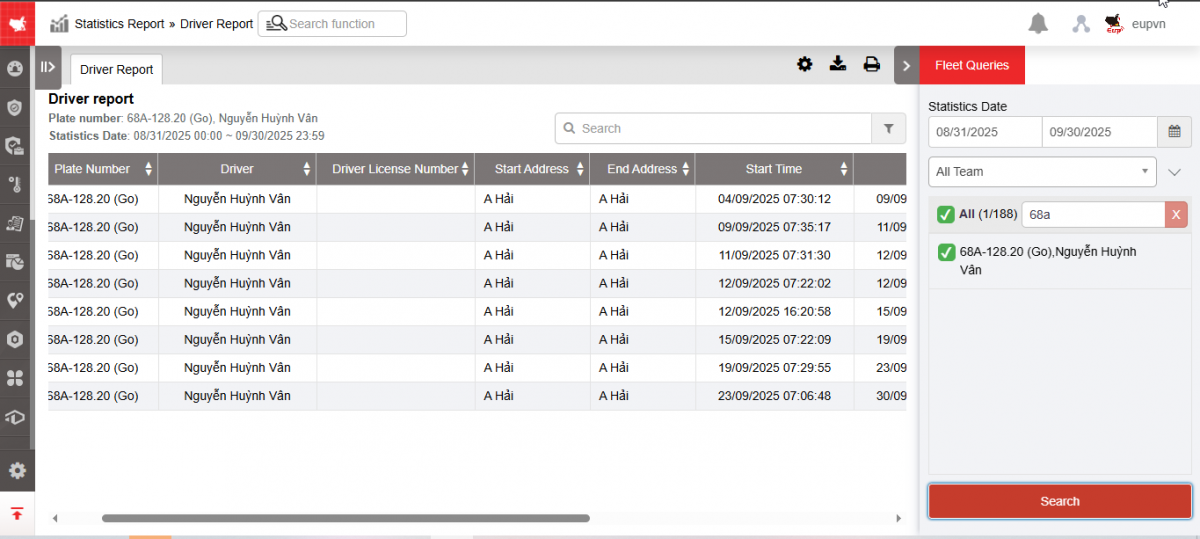
Driver report
1. Purpose
- Allows to count the number of kilometers and the time it takes for each driver to do business based on the driver's card swiping time.
2. Implementation conditions
- Customers are authorized to use option VN58
3. Implementation instructions
Step 1: Go to Statistics /Driver Report

Step 2: The function display screen consists of 2 parts:
+ Fleet queries section : allows users to select search parameters
+ Driver Report section : displays the number of kilometers and the time it takes to complete each vehicle's trip during the search period.
+ Fleet Queries section : Users can choose as follows
-
From : Select the first date you want to look up the report
-
To : Select the last date you want to look up the report
-
Fleet : Default is All fleet. Select the icon
to select the fleet -
Vehicle : User selects checkbox to select vehicle to view
-
Click Search to display search results
+ Driver report section includes the following contents:
-
Plate number
-
Driver
-
Driver license number
-
Start Address : The location where the driver first swipes the card at the start of the business trip
-
Start Time : Time the driver swipes the card at the starting address
-
End Address : The location where the driver swipes the card to end the business trip
-
End Time : Time taken by driver to swipe card at end address
-
Total time : Total time from start to end of business trip
-
Mileage (km): Number of kilometers driven from the starting address to the ending address
-
Route : Press the Route button to simulate the vehicle's route when making a business trip.
+ Select the icon to print the report
+ Select the icon to download the report in excel format
+ Select icons to customize display columns, customize license plates on reports and set up printing signatures
- Log in to post comments
- Tiếng Việt
- 繁體中文
Report without card swipe
1. Purpose
- Allows statistics on start and end times, number of kilometers of vehicle runs (vehicle runs have kilometers) but no card is swiped
2. Implementation conditions
- Customers are assigned option VN58C
3. Implementation instructions
-. To view the report, follow these steps:
Step 1: Go to the Statistics report/Report without card swipe
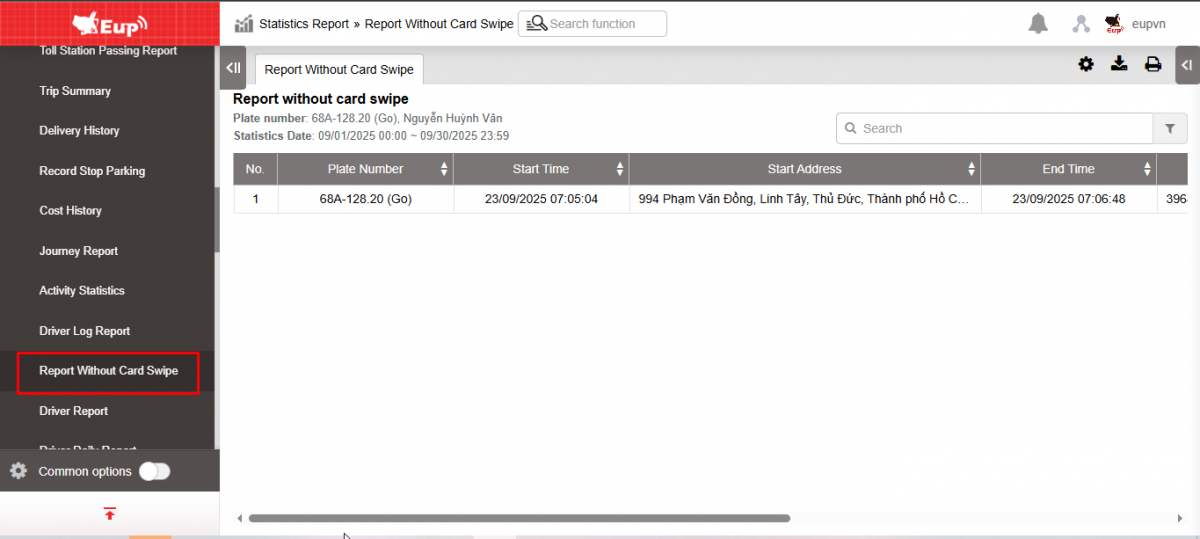
Step 2: The function display screen consists of 2 parts:
+ Fleet Queries section : allows users to select search parameters;
+ Report without card swipe section : displays detailed information about card swipe failures
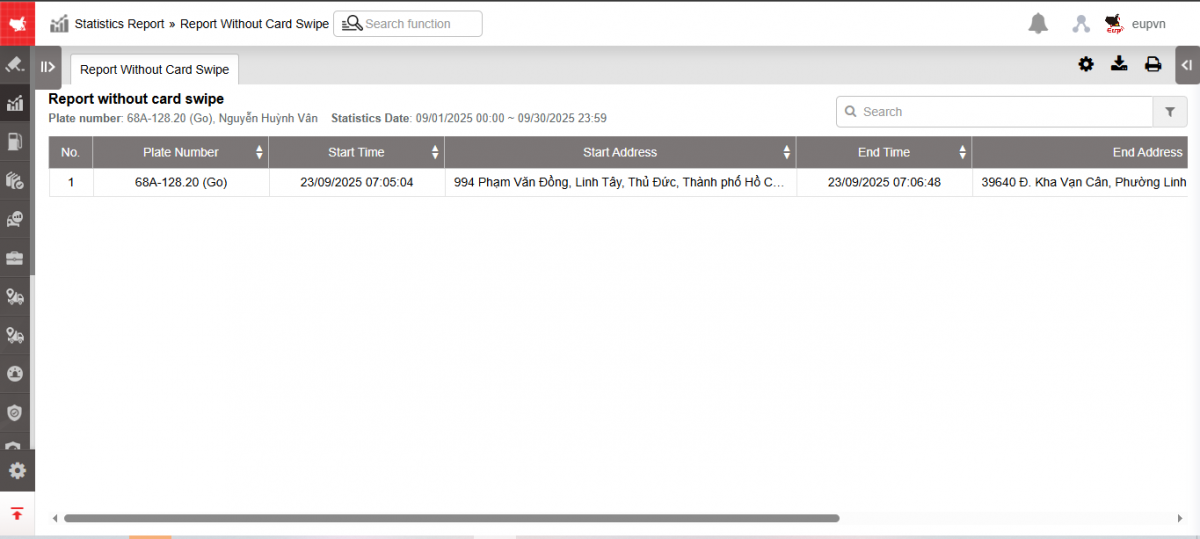
+ Fleet Queries section : Users can choose as follows
-
From : Select the first date you want to look up the report
-
To : Select the last date you want to look up the report
-
Fleet : Default is All fleet. Select the icon
to select the fleet -
Vehicle : User selects checkbox to select vehicle to view
-
Click Search to display search results
-
KM traveled > ... km : Enter the number of km to filter trips with km greater than the entered parameter
+ The Report without card swipe section includes information
-
Plate number : The license plate number that the driver will operate when swiping the card.
-
Start time : Time the car starts running (car is in green status) but the card is not swiped
-
Start address: The location where the vehicle starts running and does not swipe the card
-
End time : Time when the vehicle finishes running (vehicle is in green status) but the card is not swiped
-
End address: The location where the vehicle ends and the card is not swiped
-
Total mileage : Displays the number of kilometers the vehicle has traveled during the period of time the vehicle was running but not swiping.
-
Total time: Total time the vehicle was running without swiping the card
+ Select the icon to print the report
+ Select the icon to download the report in excel format
+ Select icons to customize display columns, customize license plates on reports and set up printing signatures
Driver daily report
1. Purpose
- Allows users to quickly count the driving time of each driver during the day
2. Implementation conditions
- Customers are authorized to use option VN58
3. Implementation instructions
- Go to menu Search statistics/Driver daily report

- The function display screen consists of 2 parts:
+ Fleet queries section : allows users to select search parameters
+ Driver daily report section : displays the number of kilometers, driving time, and stopping time of the driver for each day within the search period
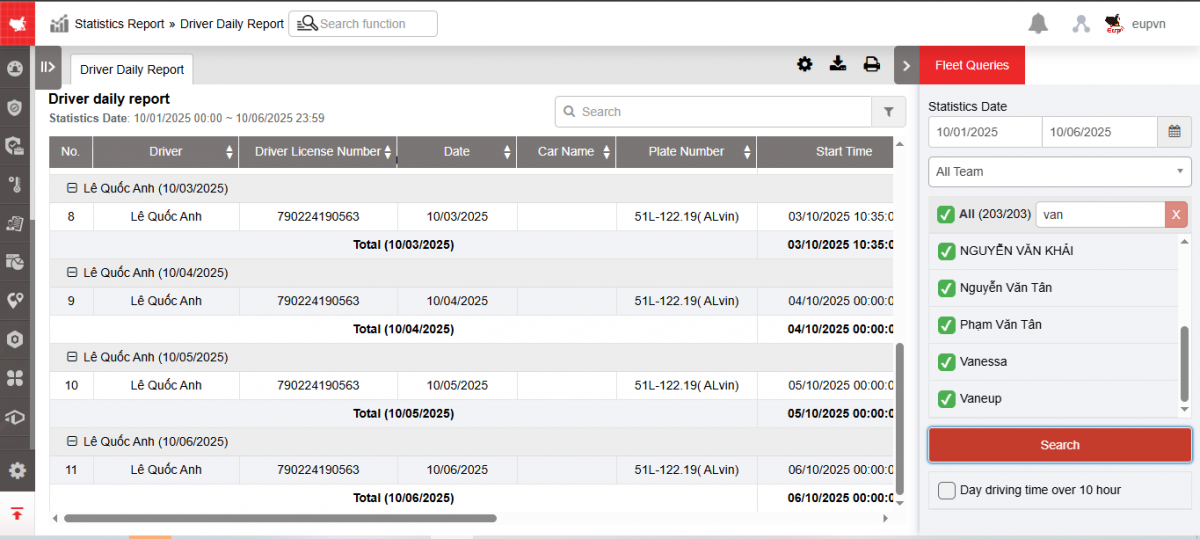
+ Fleet Queries section : Users can choose as follows
-
From : Select the first date you want to look up the report
-
To : Select the last date you want to look up the report
-
Fleet : Default is Entire fleet. Select the icon
to select the fleet -
Search driver : User searches by driver name or selects checkbox to select driver to look up
-
Click Search to display search results
-
Day driving time over 10 hour: Select the checkbox if you want to quickly count drivers whose driving time per day exceeds 10 hours.
+ The Driver daily report section includes the following information:
-
Driver
-
Driver license number: The driver's corresponding driver's license number
-
Date : The date the driver performed the job corresponding to the search time
-
Car name
-
Plate number
-
Start time: The time the driver starts swiping the card to control the vehicle
-
End Time : Time the driver swipes the card at the end of the trip
-
Mileage: Number of Km driven between start time and end time
-
Driving time: Time from start to end of trip minus stopping time
-
Turn of time: Time the vehicle is parked
+ Select the icon to print the report
+ Select the icon to download the report in excel format
+ Select icons to customize display columns, customize license plates on reports and set up printing signatures
- Log in to post comments
- Tiếng Việt
- 繁體中文
Mile statistics
1. Purpose
- Supports daily vehicle mileage statistics, from which reports on vehicle mileage during the month are available.
2. Implementation conditions
- Customers are authorized to perform the function of Mile statistics on the system.
3. Implementation instructions
Step 1: Go to Statistics report/Mile statistics
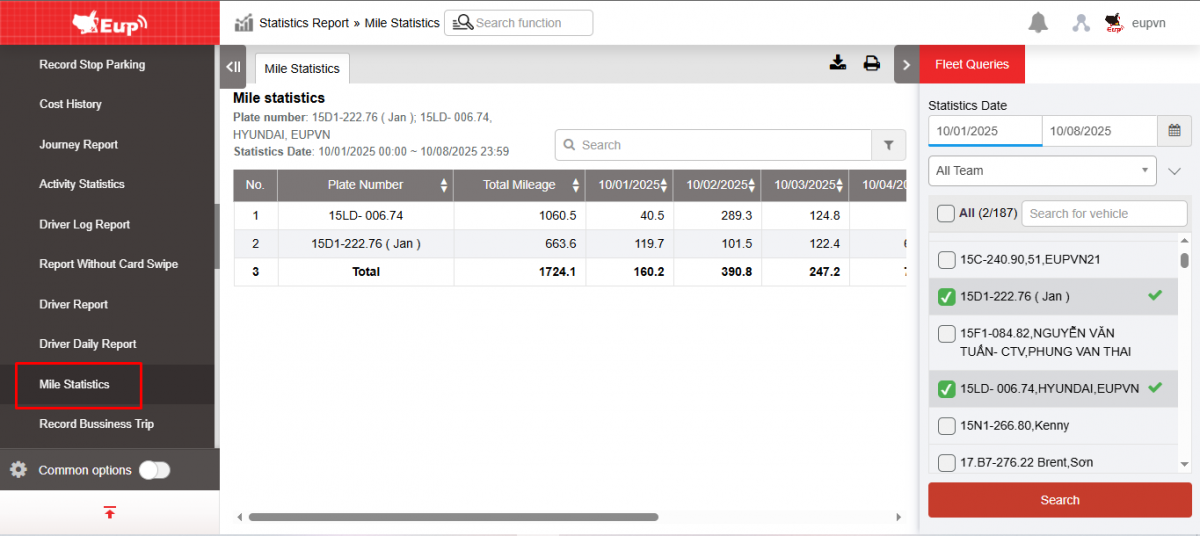
Step 2: The function display screen consists of 2 parts:
+ Fleet queries section : allows users to select search parameters
+ Report section : displays detailed vehicle mileage parameters for each day
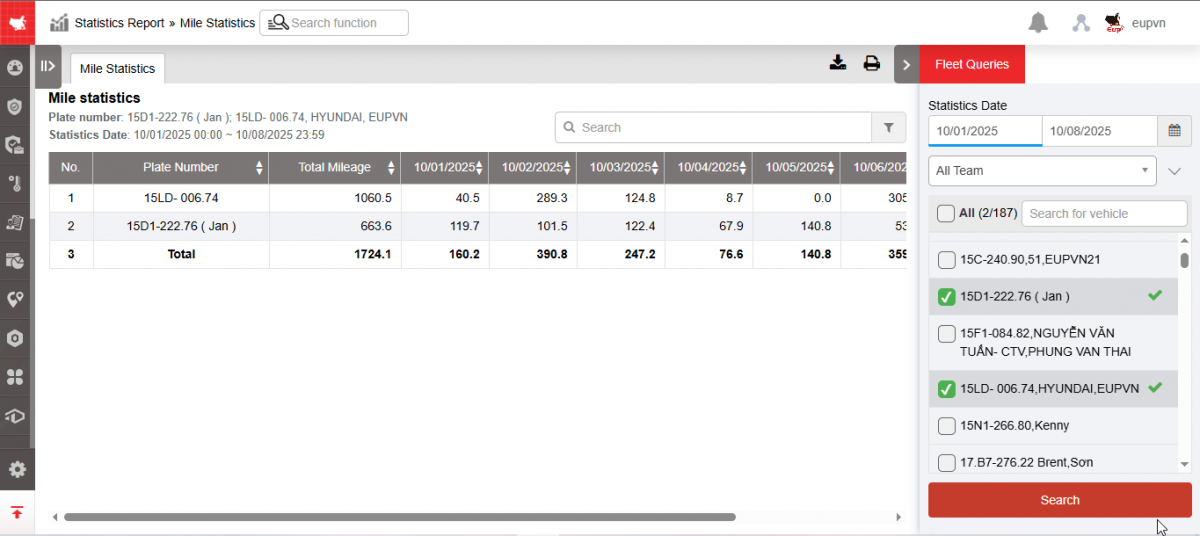
+ Fleet queries section : Includes information
-
From : Select the first date you want to look up the report
-
To : Select the last date you want to look up the report
-
Fleet : Default is All fleet. Select the icon
to select the fleet. Fleet is the list of sub-accounts that have been set up in Settings/Permissions -
Vehicle : User selects checkbox to select vehicle to view
-
Click Search to display results
+ The Report section includes
-
Plate number :
-
Total KM: Total KM the vehicle traveled in the month
-
01...31: Number of kilometers the vehicle travels each day of the month
-
Select the icon
to print the report -
Select the icon
to download the report as excel -
Select icons
to customize display columns, customize license plates on reports, and set up printing signatures
- Log in to post comments
- Tiếng Việt
- 繁體中文
Record Bussiness Trip
1. Purpose
- Allows users to check how much time it takes and how much fuel is consumed during a business trip. From there, it is possible to evaluate compliance with the route and determine the cost of the business trip.
2. Implementation conditions
- User has an account to access the journey monitoring system
3. Implementation instructions
- Go to menu Statistics report/ Record Bussiness Trip
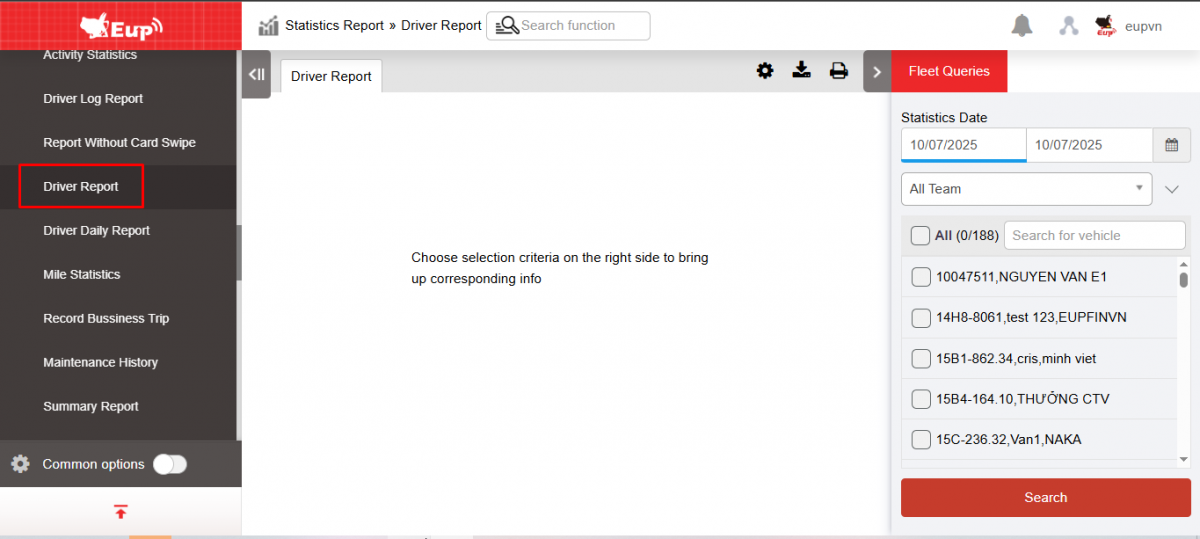
- The function display screen consists of 2 parts:
+ The Fleet Queries section allows users to set up report query conditions;
+ Record Bussiness Trip section
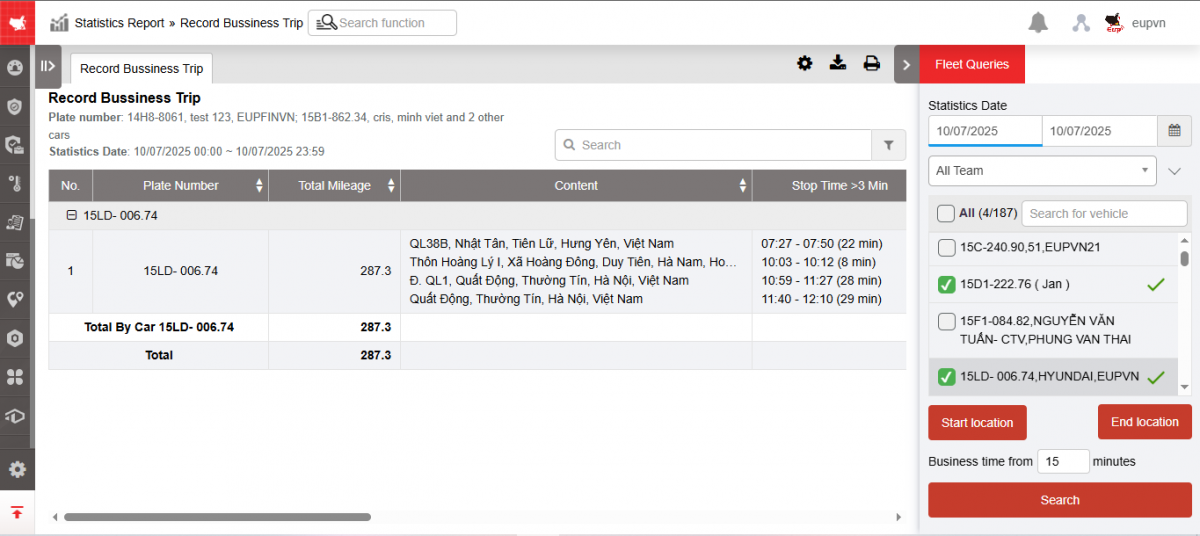
+ Fleet Queries section : Includes information
-
From date, to date : User enters the first date and last date to view the report. Allows user to view the report for a maximum of 1 month.
-
Fleet : Default is entire fleet, allowing users to select other fleets in the system
-
Vehicles: Users can select all or each vehicle in the checkboxes.
-
Start position: Is a list of milestones created by the user in the system in the milestone creation function. Allows viewing the report by starting position. If not selected, the report will display by default all starting points if there is a business trip.
-
Ending location : Is a list of milestones created by the user in the system in the milestone creation function. Allows viewing reports by ending location. If not selected, the report will display by default all ending points if there is a business trip.
Note : The default report takes the starting position and ending position according to the milestone. If the user account is assigned the VN43C option, it takes the position according to the limited area.
-
Min Km, Max Km : The report only shows business trips with Km within the Min Km and Max Km range
-
NSD selects Search to display results
+ Business trip report section : Displays information including
-
License plate number
-
Starting Position : Starting position of the business trip
-
Ending Location : The ending location of the business trip
-
Start time : Time the vehicle leaves the starting position
-
End time : Time the vehicle arrives at the end point
-
Operating time: Is the time the vehicle travels from the starting position to the ending position
-
Number of Km: Distance from start location to end location
-
Fuel Consumption : Actual number of liters of fuel the vehicle uses to travel from starting position to ending position
-
Fuel consumption : Number of kilometers the vehicle can travel when consuming 1 liter of fuel that the user has set in the Settings/General Information section
-
Route : Allows users to review the vehicle's route during a business trip on the map.
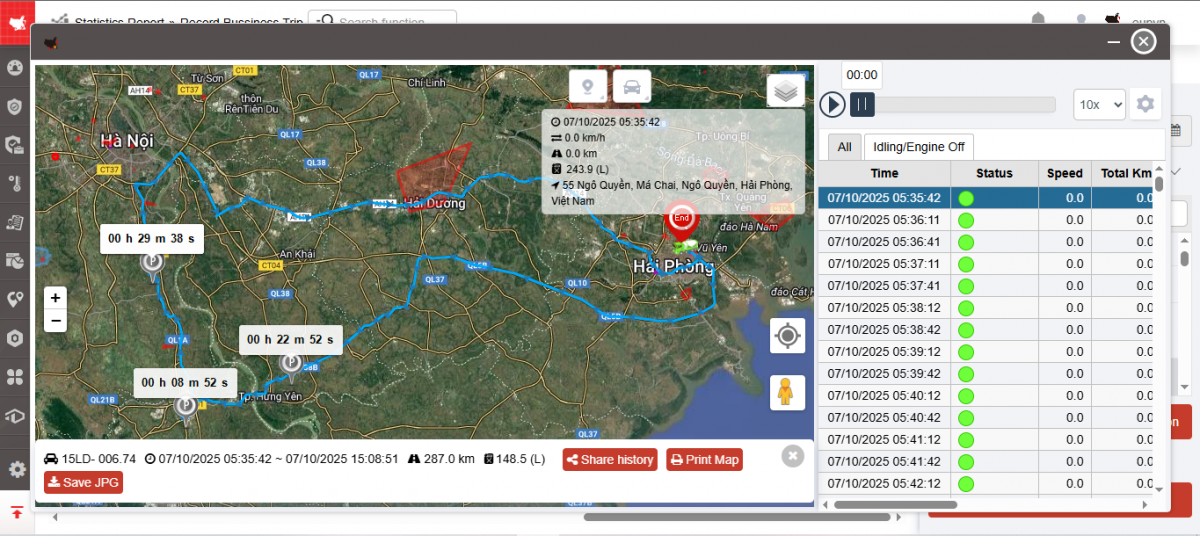
+ Select the icon to print the report
+ Select the icon to download the report in excel format
+ Select icons to customize display columns, customize license plates on reports and set up printing signatures
- Log in to post comments
- Tiếng Việt
- 繁體中文
Delivery Journey Statistics
1. Purpose
- Allows users to view detailed reports of deliveries, thereby knowing the actual time, number of kilometers, and actual fuel consumption that differs from the initial estimate.
2. Implementation conditions
- User is authorized to use option VN43
3. Implementation instructions
- Go to menu Statistics report/Delivery Journey Statistics

- The function display screen consists of 2 parts:
+ The Fleet Queries section allows users to set up information to display reports;
+ The Report section displays detailed report indicators according to query parameters. Users can print and export report files.

+ Fleet Information section includes the following information:
-
From : Select the first date you want to look up the report
-
To : Select the last date you want to look up the report
-
Fleet: Default and allows selecting other fleets in the system
-
Vehicle : User can select 1 or more vehicles in the selected fleet by checking the checkbox.
-
Select Search to display results
+ The Report section displays detailed data according to the following indicators:
-
Date : Date of delivery
-
Plate number
-
Start Location: The starting location of the delivery (Milestone)
-
End Location : The end location of the delivery (Milestone)
-
Staff code
-
Start time : Time when the vehicle leaves the starting position
-
End Time: The time the vehicle reaches the end point of the delivery trip
-
Operation time : Time for vehicle to travel from start position to end position
-
Stop time : Time the vehicle stops during the delivery trip
-
Standard distance: Estimated distance set by user in Settings/ set landmark/ set distance
-
Actual distance: The actual distance the monitoring device measured between the start point and the end point
-
Difference distance: The difference in distance between the standard distance and the actual distance
-
Fuel consumption: The actual fuel consumed by the vehicle during the delivery trip
-
Actual Fuel Consumption on 100 KM = 100*Actual fuel consumption/actual distance
-
Norm Fuel Consumption on 100 KM = 100/Fuel consumption Km/L that the user sets up in settings/basic information/vehicle information
-
Diff Fuel Consumption on 100 KM: Difference between rated fuel consumption per 100km and actual fuel consumption converted per 100km
+ Select the icon to print the report
+ Select the icon to download the report in excel format
+ Select icons to customize display columns, customize license plates on reports and set up printing signatures
- Log in to post comments
- Tiếng Việt
- 繁體中文
Maintenance history
1. Purpose
- Allows users to view detailed vehicle maintenance information according to each lookup period
2. Implementation conditions
- The user is authorized to use the Maintenance History function (VN73) and turn off the Settings/Warning Settings feature (VN27) on the authorization system.
3. Implementation instructions
- Go to menu Statistics report/Maintenance history

- The function display screen consists of 2 parts:
+ The Fleet Queries section allows users to set up information to display reports;
+ The Maintenance History section displays detailed maintenance-related information in report form.
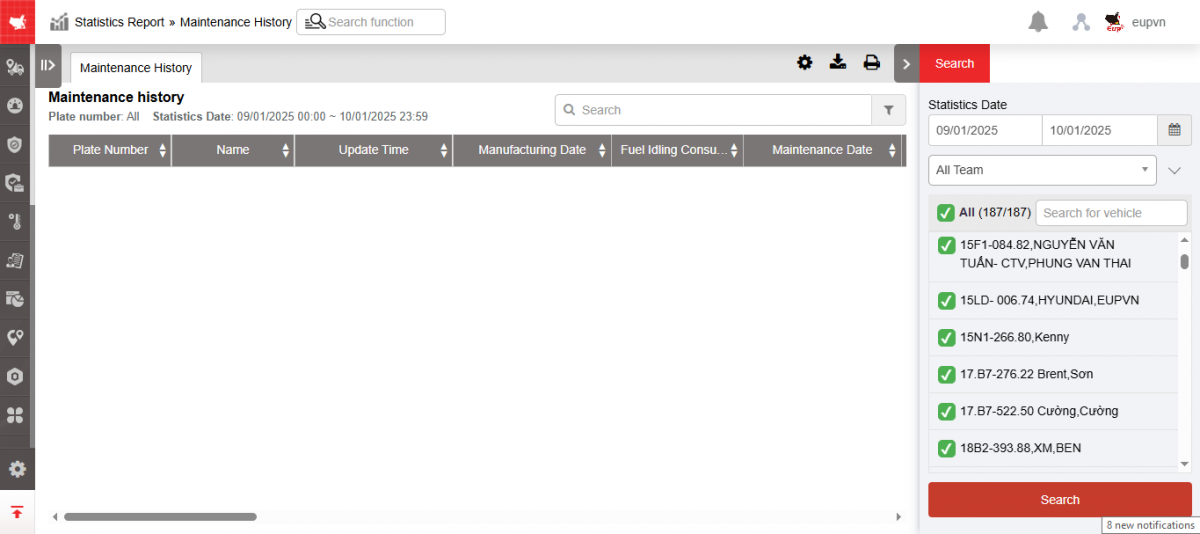
+ Fleet Queries section includes the following information:
-
From : Select the first date you want to look up the report
-
To : Select the last date you want to look up the report
-
Fleet: Default and allows selecting other fleets in the system
-
Vehicle : User can select 1 or more vehicles in the selected fleet by checking the checkbox.
-
Select Search to display results
+ The Maintenance History section displays detailed data according to the entered criteria in the Settings/Basic Information/Maintenance Check function.
-
Plate number
-
Name
-
Update time: The date the maintenance information change was made in the Settings/ Basic Information/ Maintenance Check function
-
Manufacturing Date
-
Fuel idling consumption(L/Hr): The maximum number of kilometers at which a vehicle must be maintained.
-
Maintenance Date: Date of most recent maintenance
-
Next Maintenance Date: Next scheduled maintenance date
-
Total Mileage: Total km traveled to date (accumulated km is calculated from the date of GPS device installation or from the most recent maintenance date to the present)
-
Remaining mileage = Standard km - Accumulated km
-
Mileage reminder: Set the remaining Km number that needs to be reminded. When the remaining KM number <= the remaining Km reminder number, a reminder will be given.
Example: Remaining Km = 50km (vehicle reaches the standard Km limit)
If the remaining reminder KM setting is 60 km or 50 km, a reminder notification will be displayed.
-
Last checkup date: Date of the most recent vehicle inspection
-
Next checkup date
-
Km on car
-
Insurance expiration
-
Registration Expiry Date
-
Badge Expiry Date
-
Maintenance Expiry Date 1
-
Maintenance Expiry Date 2
-
Tire Check Date
-
Accumulator Check Date
-
Oil check date
-
Clutch Check Date
-
Amaza Test Date
-
Recent service date
-
Next service date
+ Select the icon to print the report
+ Select the icon to download the report in excel format
+ Select icons to customize display columns, customize license plates on reports and set up printing signatures
- Log in to post comments
- Tiếng Việt
- 繁體中文
Report center
1. Purpose
- Allows users to synthesize information on Operating time, Stopping time, Distance, Number of stops, Average speed, Detailed route of the vehicle by day within the search period.
2. Implementation conditions
- Users are authorized to Report center in the Authorization function of the system.
3. Implementation instructions
- Go to the Statistics report/Report center

- The display function screen consists of 2 parts:
+Fleet Queries section allows users to set time parameters and vehicles to view reports;
+ Report center display detailed report indicators according to query parameters. Users can print and export report files.

- Fleet Information Section
Users select the following options to generate vehicle activity reports:
-
From: Select the first date to query the report
-
To: Select the last date to query the report
-
Fleet: Default option, but allows selecting other fleets available in the system
-
Vehicle: The user can select one or multiple vehicles in the chosen fleet by checking the checkbox
-
Search: Click to display the results
- Report center display information
-
Vehicle type: Vehicle icon information corresponding to the license plate configured in Settings / Basic Information / Vehicle Information
-
License plate:
-
Toll fee: Road toll costs incurred during the day
-
(1) Distance traveled: Number of kilometers the vehicle traveled during the day
-
(3) Fuel norm (Liters/hour): Standard fuel consumption per hour (liters/hour) configured in Settings / Basic Information / Vehicle Information
-
Fuel consumption (Liters/hour): Standard hourly fuel consumption, calculated as formula (3) Fuel norm (Liters/hour) × (4) Working time
-
(2) Fuel norm (Km/Liter): Standard fuel consumption per kilometer (km/liter) configured in Settings / Basic Information / Vehicle Information
-
Fuel consumption (Km/Liter): Standard kilometer-based fuel consumption, calculated as formula (2) Fuel norm (Km/Liter) × (1) Distance traveled
-
Actual fuel consumption: Fuel consumption measured by the fuel sensor (Column enabled with option VN67A)
-
Total air-conditioner usage time: Time using A/C = IO1 + IO2
-
Average speed: The vehicle’s average speed during the day
-
Maximum speed: The vehicle’s maximum speed within the selected date range
-
Overspeeding (≥80km/h): Number of times the vehicle speed was ≥80km/h in the day
-
Idle without engine off (≥15 minutes): Number of times the vehicle was idle without engine off for ≥15 minutes
-
Date:
-
Start time: The time the vehicle started operation in the day
-
End time: The time the vehicle ended operation in the day
-
Operating time: Total time the vehicle was in running state during the day
-
Parking time: Total time the vehicle was parked during the day
-
Total parking events: Total number of parking events in the day
-
(4) Working time: Total time = Running time + Idle without engine off during the day
-
Start location, End location: The starting and ending locations of the trip, displayed based on milestone name
-
Route: Click the Route button to open a tab showing detailed route information of the vehicle for the day

-
Details: Click the Details button to open a tab showing the vehicle’s detailed information for the day

-
Engine Off: Click the Engine Off button to open a tab displaying detailed information on the vehicle’s parking locations during the day

+ Select the icon to print the report
+ Select the icon to download the report as excel
+ Select the icon to Custom Field, Plate number field settings, Print signature settings
- Log in to post comments
- Tiếng Việt
- 繁體中文
Summary Report GPS
1. Purpose
- Allows users to view status information, working hours, and operating location of vehicles equipped with GPS devices.
2. Implementation conditions
- Users are authorized to Summary Report GPS at the system's authorization function.
3. Implementation instructions
- Go to menu Search statistics/ Summary Report GPS
- The function display screen consists of 2 parts:
+ Fleet queries section is the section that allows users to select conditions to display the report.
+ The Summary Report GPS section displays detailed information of vehicles with GPS devices installed
.
+ Fleet queries section , user selects the following information
-
From : User enters the first date he wants to view the report
-
To : User enters the last date to view the report
-
Fleet : User selects icon
to select fleet, default is Whole fleet -
Vehicle : User selects icon
to select specific vehicle, default to all vehicles -
Click Search to display report information in the Summary Report GPS section
+ The Summary Report GPS section includes the following information:
-
No
-
Plate number
-
Partner: Vehicle name set in Settings/ Basic information/ Vehicle information
-
Car status: Vehicle status at the last time (Search until 2:00 p.m. on August 27, 2020 to get the vehicle status at 2:00 p.m. on August 27, 2020).
Note : In case the user is assigned the VN99A option, the system will display the reason for disconnection and the time the vehicle disconnected (Time of sending the vehicle's last record up to the time of lookup) for vehicles with the Status of Disconnected.
For example : The vehicle lost signal at 16:00:00 on October 20, 2022 and has not reconnected to December 5, 2022. When searching the report for December (December 1, 2022 - December 5, 2022), the report is: GSM/GPS connection stopped (October 20, 2022 16:00:00)
-
End location: The vehicle's last active location (If the search ends at 2:00 p.m. on August 27, 2020, the active location of the vehicle will be at 2:00 p.m. on August 27, 2020). If the location is a landmark, the landmark name will be displayed.
-
Start Date: Search period from date
-
End Date : Search time to date
-
Total work hours (HH:MM:SS format) = Total time the vehicle is in Stop state without turning off the engine + driving
-
Total stop Work hour (HH:MM:SS format) = Time spent stopping the vehicle with the engine off
Note : If User is assigned option VN99A, Total stop work hour = Time to stop the vehicle and turn off the engine + Time to lose connection => Total lookup time (from ... to) = Total working hours + Total downtime.
-
Mileage (km): Number of kilometers the vehicle has traveled from day to day (according to the lookup period)
-
Norm km: KM standard in maintenance check section
-
Maintenance due warning: is the Km reminder at the maintenance check
-
Inspection Due Date: Inspection Expiration Date at Maintenance Check
-
Insurance expiration: Insurance expiration date at maintenance check
-
Toll Station Expiry Date: Road toll expiration date at maintenance check
-
Total Cost: Total costs incurred in Cost Management (by lookup period). With email reports, get the accumulated costs incurred up to the time of sending the report.
-
Customize : Install in Settings/ Basic information/ Car information
+ Select the icon to print the report
+ Select the icon to download the report in excel format
+ Select icons to customize display columns, customize license plates on reports and set up printing signatures
- Log in to post comments
- Tiếng Việt
- 繁體中文
Event history
1. Purpose
- Allows users to track event history including abnormalities and reminders set in Settings/Alert Settings (Used when Show new alerts is enabled in Settings/Basic Information )
2. Implementation conditions
- Users are authorized to use the Event History function on the CRM system.
3. Operation
- Go to menu Statistics report / Event History
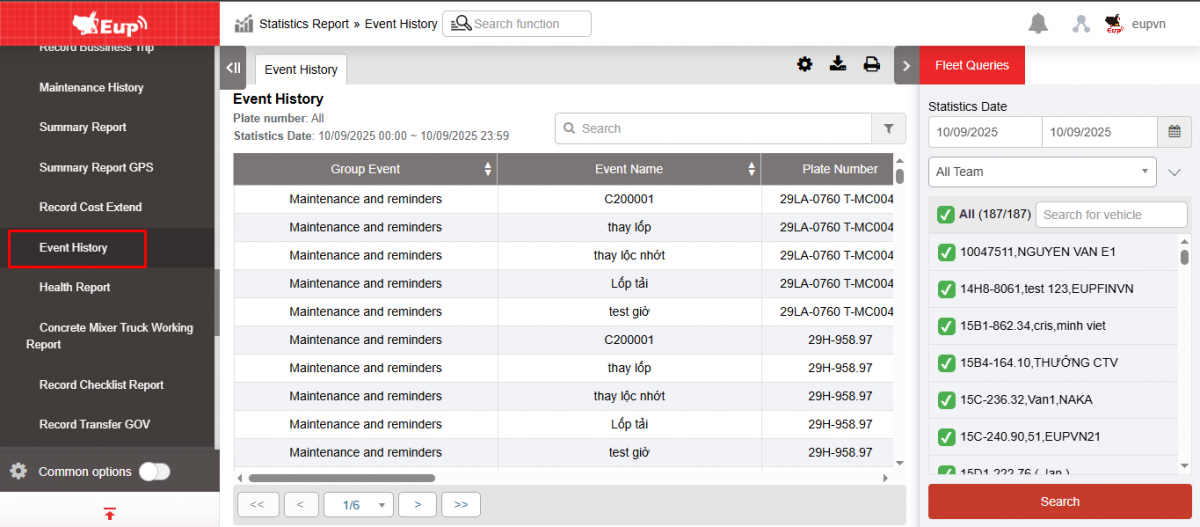
- The function display screen consists of 2 parts:
+ Fleet Queries section allows users to search for delivery orders within a period of time.
+ The Event History report section allows users to review the history of reminder and unusual events.
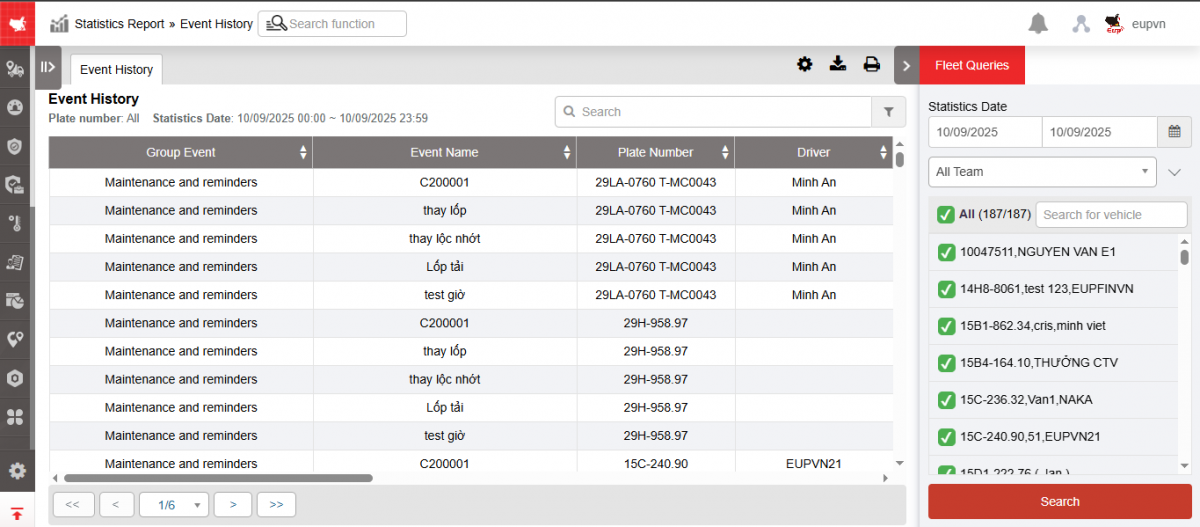
+ Fleet Queries section allows users to search for delivery orders within a period of time.
-
From: User selects the first date they want to search
-
To: User selects the last date they want to search
-
Fleet: Default display system, user can select the fleet to search
-
User selects the icon
 to select the license plate number they want to search for.
 -
Click Search to display search results
+ The Event History report section allows users to check the following information:
-
Group event
-
Event name
-
Plate number
-
Driver
-
Start Time: The time the warning started
-
End Time: Warning end time
-
Start Adress: Location where the violation began
-
End Adress: The location where the violation ended
-
Content
-
Status: Not Started, In Progress
+ Select the icon to print the report
+ Select the icon to download the report in excel format
+ Select the icon to set the display or hide or change the sort order of the report columns,
Health report
1. Purpose
- This function allows statistical reporting of alcohol concentration measurements of each driver (only applicable to drivers with alcohol concentration measurements).
2. Implementation conditions
- Users are authorized according to option: 4K.
3. Implementation instructions
- Go to menu Statistic report/Health report
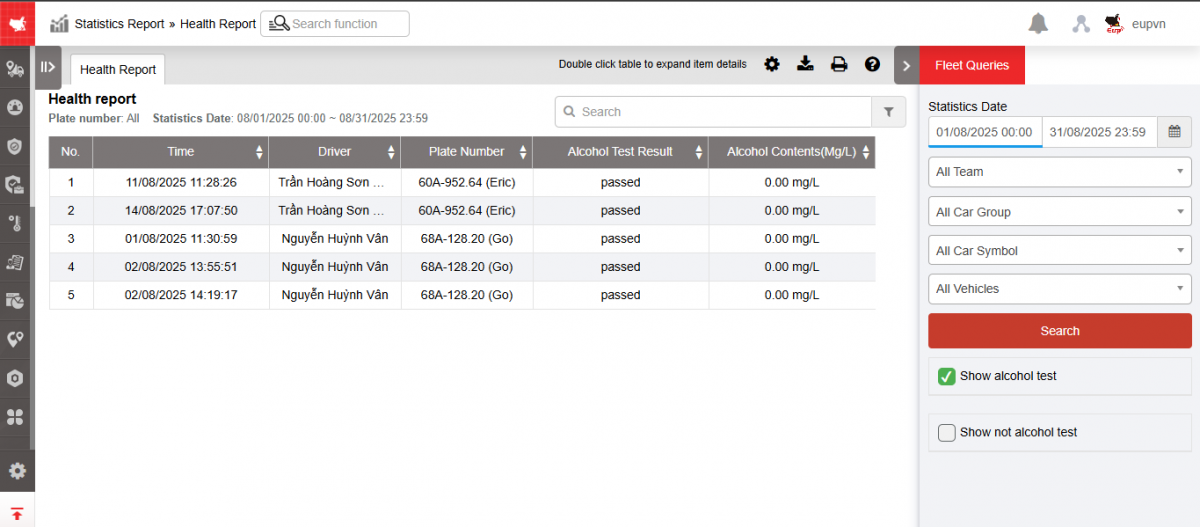
- The function screen consists of 2 parts:
+ Fleet Queries section allows users to select fleet, driver and time period to report
+ Health report

+ Fleet Queries section : Includes the following information:
-
Whole fleet : User can press button
 to select fleet according to report request;
 -
All drivers: User can press button
to select report by driver name; -
From: User selects the first day to report;
-
To: User selects the last date to report.
-
Checkbox Show alcohol test
-
Checkbox Show not alcohol test
+ Detailed Report section : Displays alcohol concentration measurements along with corresponding driver information. Includes information:
-
Time : Date and time the driver measured alcohol concentration;
-
Driver;
-
Plate number;
-
Alcohol Test Result: Displays the driver's alcohol concentration measurement result;
-
Alcohol contents(mg/L): Displays the driver's alcohol concentration % when measuring alcohol concentration;
-
Select the icon
to print the report -
Select the icon
to download the report as excel -
Select icons
to customize display columns, customize license plates on reports, and set up printing signatures -
Select the icon
 to view the Standard Table of Indicators
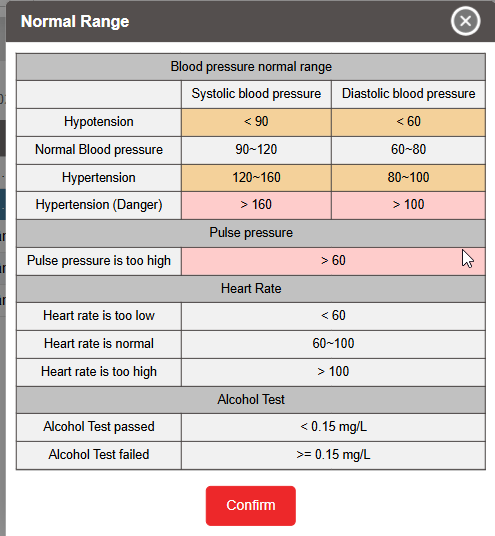
- Log in to post comments
- Tiếng Việt
- 繁體中文
Concrete Mixer Truck Working Report
1. Purpose
- Allows users to check and monitor the concrete mixing status of each vehicle or each vehicle team over time.
2. Implementation conditions
- Users are authorized to perform specific functions on the CRM system.
3. Implementation instructions
- Go to menu Statistics report /Concrete Mixer Truck Working Report
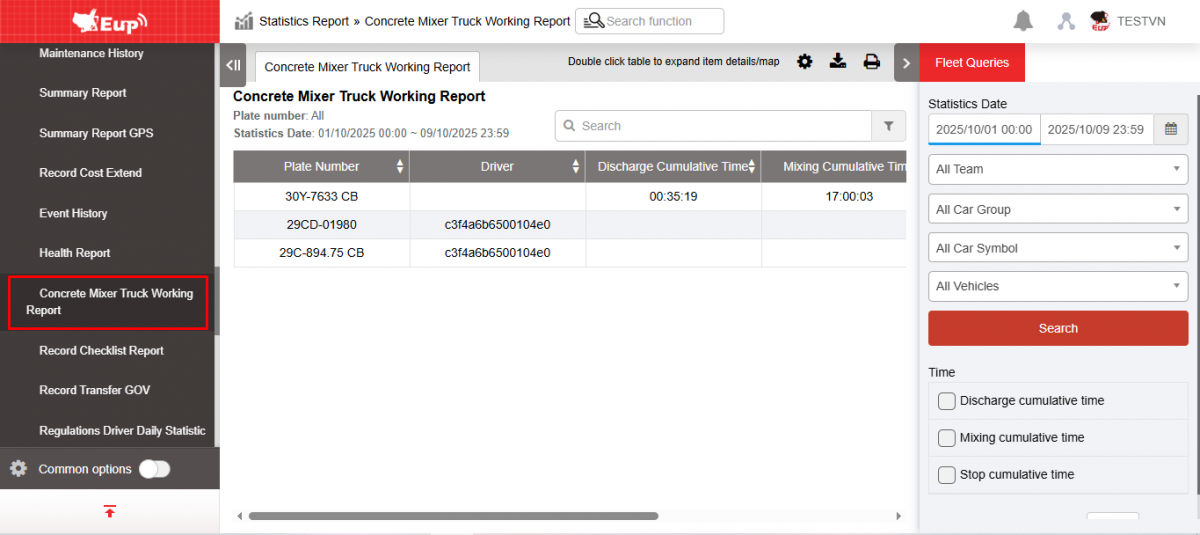
- The function display screen consists of 2 parts:
+ The Fleet Queries section allows users to search for information based on vehicle and time criteria;
+ The Concrete Mixer Truck Working Report section displays details of concrete discharging, mixing, stopping time and the number of abnormal concrete discharges of each vehicle.
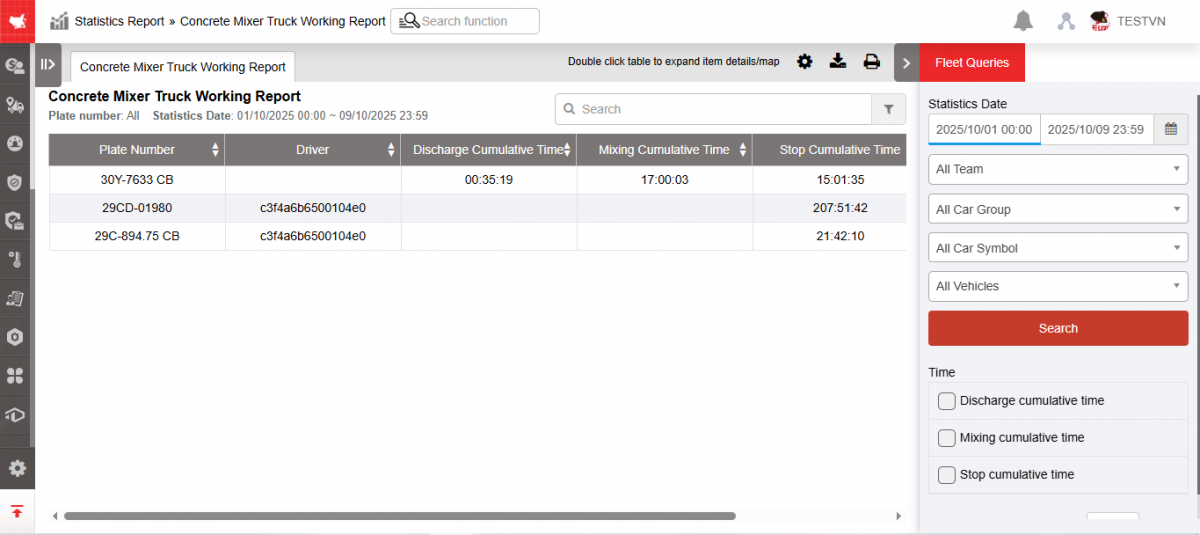
+ Fleet Queries section : User selects the following information
-
From : User enters the first date he wants to view the report
-
To : User enters the last date to view the report
-
Fleet : Allows selecting the corresponding vehicle fleet to look up, default is All vehicle fleet
-
All car group: Select the corresponding vehicle type group to look up, default All vehicle type groups (Vehicle type groups are displayed according to Settings/Vehicle type list)
-
All car symbol: Select the corresponding vehicle type to look up, default All vehicle types (Vehicle types are displayed according to the list in Settings/ Basic information/ Vehicle information/ Vehicle icon)
-
All Vehicles: Select the corresponding vehicle to look up, default to Entire fleet
-
Click Search to display report information in the Concrete Mixer Truck Working Report section
-
Time: Select the corresponding check box to report the filter: Discharge cumulative time, Mixing cumulative time, Stop cumulative time
-
Abnormal Discharge setting (Minutes): Set the concrete discharge time filter to be counted as abnormal
-
If no temporary station is selected, discharge outside the main station and any restricted area (construction site) is abnormal.
-
If a temporary station is selected, discharge outside the temporary station and any restricted area (construction site) is irregular.
-
+ The Concrete Mixer Truck Working Report section allows displaying the following information:
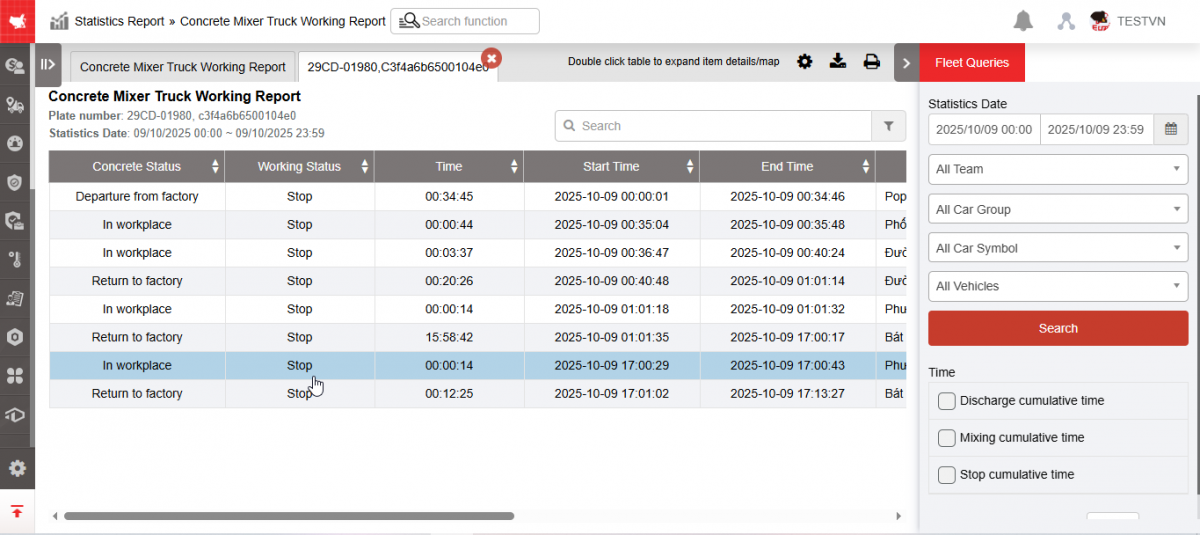
Summary report:
-
Plate number
-
Driver : The corresponding driver name is assigned to the BSX
-
Discharge cumulative time: Is the time the vehicle discharges and pours concrete
-
Mixing cumulative time: Is the time the vehicle takes to mix the concrete.
-
Stop cumulative time: Is the time the vehicle stops mixing concrete
-
Abnormal Discharge Count: Number of times the vehicle discharges concrete abnormally (discharges outside the workshop or factory) exceeding the number of minutes set in Car Information/ Abnormal discharge time (Minutes )
Click on the line you want to see details about, the system will display the Detailed Report screen:
-
Concrete Status : Status of concrete truck (In station, Out of factory, On site, Back to factory, No status)
-
Working status : Working status of concrete truck (Mixing, Preparing to mix, Discharge, Stop)
-
Time: Total time the vehicle is in working state and the corresponding concrete state (Equal to End time - Start time)
-
Start Time: The time the new working status starts
-
End Time : Time the working status ends
-
Adress: The location where the vehicle starts to change its working status.
-
Click on the line in the Detailed Report, the system displays the map corresponding to the vehicle.
+ Select the icon  to print the report
+ Select the icon  to download the report in excel format:
+ Select the icon  to set the display or hide or change the sort order of the report columns
Record Concrete Business Trip
1. Purpose
- Allows users to check the concrete discharge location and concrete discharge time during a trip. From there, detect unusual concrete discharge trips.
2. Implementation conditions
- The user has an account to access the journey monitoring system, use concrete sensors and is authorized to report concrete mixer trips.
3. Implementation instructions
- Go to menu Statistics report/ Record Concrete Business Trip
- The function display screen consists of 2 parts:
+ The Fleet Queries section allows users to set up report query conditions;
+ Record Concrete Business Trip section
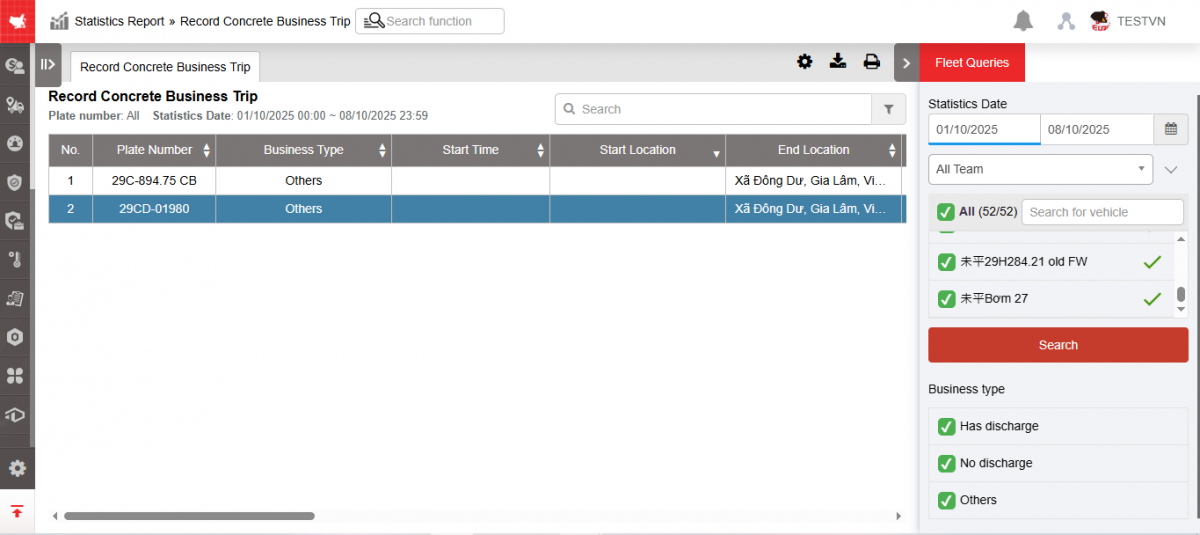
+ Fleet queries section: Includes information
-
From...to: User enters the first date and last date to view the report. Allows user to view the report for a maximum of 1 month.
-
Fleet: Default is entire fleet, allowing users to select other fleets in the system
-
All team: Default is all vehicle fleet groups, allowing users to select other vehicle groups in the system
-
All symbol: Default is all vehicle types, allowing users to select other vehicle types in the system
-
Vehicles: Users can select all or each vehicle in the checkboxes.
-
NSD selects Search to display results
-
Business type: Users can select the type of business trip to display in the checkboxes.
- Has discharge: A trip with start and end locations at the factory and with a discharge signal
- No discharge: A trip with start and end locations at the factory and no discharge signal
- Other: Trips in the following cases
- Stop at the factory or any location all day
- Workshop activities
- Has a starting position at the factory, then ends at any location and stops at that location without returning to the factory
+ Record Concrete Business Trip section: Displays information including
-
STT
-
Plate number
-
Business Type: Name of 3 trip types
-
Start Time: The time the vehicle begins to leave the workshop area
-
Start location: The position where the vehicle starts leaving the workshop area
-
End location: The position where the vehicle starts entering the workshop area
-
Discharge Address: Position with discharge signal according to concrete sensor
-
The first discharge location is the location with the first discharge signal and is recorded as the first discharge point after leaving the workshop area >3 minutes. Discharge points within a radius of 250m from the first discharge point will be counted as one discharge.
-
Subsequent discharge positions are recorded by the concrete sensor.
-
-
Discharge start time: Is the time from the start of discharge to the end of concrete discharge time
-
Since the first flush includes multiple flushes within a 250m radius, the flush start time of the first flush is recorded from the start of the first flush to the end of the last flush.
-
Subsequent discharges are calculated according to the concrete sensor: Discharge start time to discharge end time
-
-
Discharge Mins: Total number of flushing minutes according to concrete sensor
-
Idle Mins: Total number of minutes the vehicle was stopped without turning off the engine (blue state)
-
TurnOff Mins: Total number of minutes the vehicle was in parked state (gray state)
-
End Time: The time the vehicle begins to enter the zone
-
Go km: Distance from Start Location to First Discharge Location
-
Back km: Distance from First Discharge Location to End Location
-
Total km: Total km for outbound and return
-
Diff km: Number of Km difference between outbound and return (Km return - Km outbound )
-
Toll station: Name of the toll station that the vehicle passed through during a trip.
-
Route : Allows users to review the route of a vehicle on a map
-
Fuel Norm: The amount of fuel consumed according to the standard when the vehicle is stopped without turning off the engine and when the vehicle is running is calculated according to the formula:
-
(Number of minutes of stopping without turning off the engine * Liter/hour) + (Total km * Liter/100km)
-
Fuel consumption standards in L/Hour and L/100km are set in the Vehicle Information tab under Settings/Basic Information
-
-
Fuel real: Fuel consumption according to fuel sensor
-
Route
- Select the icon to print the report
- Select the icon to download the report in excel or word format.
- Select icons to customize display columns, customize license plates on reports and set up printing signatures
Record Dispatch Car
1. Purpose
- Allows users to track vehicles that have been and have not been dispatched to deliver goods, thereby being able to arrange vehicle dispatch appropriately.
2. Implementation conditions
- The user has an account to access the journey monitoring system and is authorized to use the Vehicle Control Panel function.
3. Implementation instructions
- Go to menu Statistics report/Record Dispatch Car
- Record Dispatch Car display function screen includes the following information:
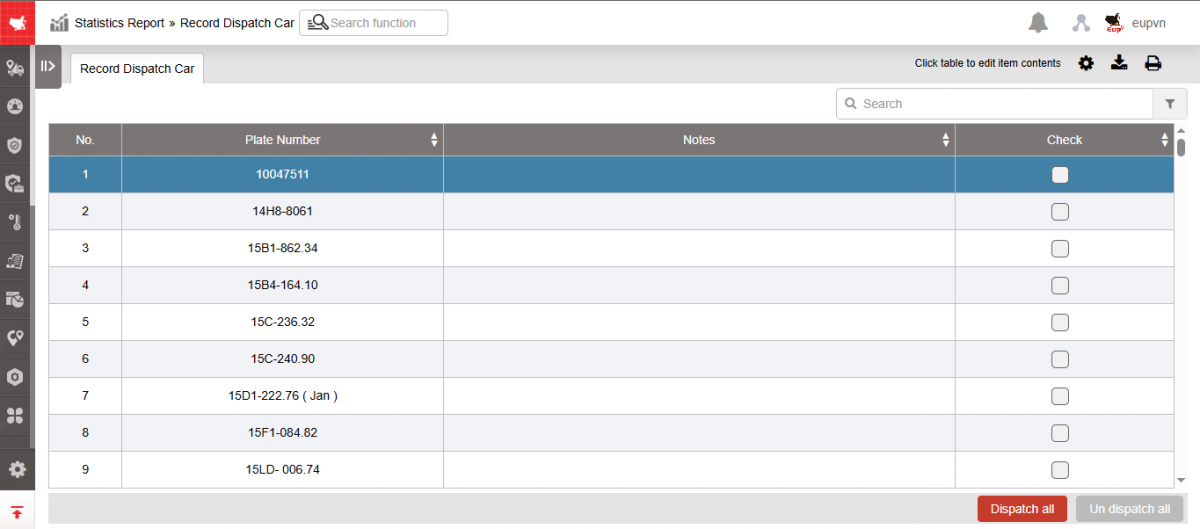
-
STT
-
Plate number
-
Notes: Allow user to enter up to 250 characters
-
Check: Checkbox to Check/Uncheck the vehicle that has been controlled
-
Dispatch all: Select all vehicles
-
Un dispatch all: Uncheck all vehicles
* The order of arrangement when checking/unchecking is as follows:
-
When dispatching a vehicle: Select the license plate number and the vehicle will be arranged in order down to the end of the line.
-
When using the All Vehicles Control button, if some vehicles have been controlled, they will be pushed to the top in order and the uncontrolled vehicles will be pushed to the bottom in order.
-
When using the Cancel all vehicles button, the vehicle list will be rearranged in A - Z order.
- Select the icon to print the report
- Select the icon to download the report in excel format
- Select icons to customize display columns, customize license plates on reports and set up printing signatures
Record checklist report
1. Purpose
- Support users to monitor and manage checklists to check all contents and current status of vehicles such as urgent repair, early repair, no repair needed,...
2. Implementation conditions
- Users are authorized to choose option VN36 or VN36A.
3. Implementation instructions
- Go to the menu Statistics report»Record checklist report.

- The display function screen consists of 2 parts:
+ Fleet Queries section allows users to set up time parameters and vehicles to view the report;
+ Record checklist report section Display detailed checklist content and status

+ Fleet Queries section: the user selects the following information:
-
Select month: allows user to look up time by month
-
Team: Default is All team. Select the icon
 to select the team
 -
Click Search button to display the report
+ Record checklist report section allows to display the following information:
-
Checklist content: list of all items, item groups set by the user in the Driver Statistics report/Inspection settings
-
Car state: display vehicle status OK/NO depending on the driver's selection and sending, the checklist will be displayed on the operating accounts, approval accounts, and admin accounts
-
Solution: including Priority repair/urgent replacement; Need early repair; No urgent repair; Other (user's content). Resolution direction is entered by the operating account/admin account.
-
Approve: by the approval account/admin account, select each item to agree to approve or uncheck to disapprove. Or select Approve to approve all items
+ Select the icon to print the report
+ Select the icon to download the report as excel
+ Select the icon to Custom Field, Plate number field settings, Print signature settings
Record transfer GOV
1. Purpose
- Allows users to monitor data transmission status to the GOV.
2. Implementation conditions
- The user is authorized to perform functions in the authorization section (Option VN02M)
3. Implementation instructions
- Go to the menu Statistics report»Record transfer GOV.

- The display function screen consists of 2 parts:
+ Fleet Queries section allows users to set up time parameters and vehicles to view the report;
+ Record transfer GOV

+ Fleet Queries section: the user selects the following information:
-
From: User enters the first day to view the report
-
To: User enters the last day to view the report
-
Team: User selects the icon
to select the vehicle fleet, default is All vehicle fleet. According to the sub-account settings in Settings/Permissions -
Checkbox drive or select all
-
Click Search button to display the report
+ Record transfer GOV:
-
Plate number
-
Status: Transmitting and Stopped transmitting
-
Last data transmission time
-
Total transmitted record: Number of messages transmitted to GOV during the lookup period
+ Select the icon to print the report
+ Select the icon to download the report as excel
+ Select the icon to Custom Field, Plate number field settings, Print signature settings
Regulations driver daily statistic
1. Purpose
- Allows users to count the driving time of each driver during the day, thereby being able to control the working time of each driver.
2. Implementation conditions
- The user is granted permission for the Regulations driver daily statistic function on the CRM system.
3. Implementation instructions
- Go to the menu Statistics report»Regulations driver daily statistic.

- The display function screen consists of 2 parts:
+ Fleet Queries section allows users to set up time parameters and vehicles to view the report;
+ Regulations driver daily statistic section displays each driver's driving time of the day


+ Fleet Queries section: the user selects the following information:
-
Select day/month/year
-
Team: Default is All team. Select the icon
to select the team -
Checkbox drive or select all
-
Click Search button to display the report
+ Phần Thống kê thời gian lái xe trong ngày theo lái xe:
-
Driver;
-
Plate number;
-
Date within the Search Time Period
+ Time: Total driving time from start to finish of the driver in each trip and in a day
+ Miles: Total Km in the driving time in a day
-
Time accumulation: Total driving time during the day during the lookup period
+ Select the icon to print the report
+ Select the icon to download the report as excel
+ Select the icon to Custom Field, Plate number field settings, Print signature settings
+ Select the icon  to filter the report.