Abnormal Report
1. Purpose
- Support users in aggregating the number of violations by drivers for each type of violation.
2. Implementation conditions
- The user is granted permission for the Abnormal Report function on the CRM system.
3. Implementation instructions
- Go to the Abnormal Report»Abnormal Report.

 - The display function screen consists of 2 parts:
+ Fleet Queries section allows users to set up time parameters and vehicles to view the report;
+ Report details section display the number of violations for each type of violation.
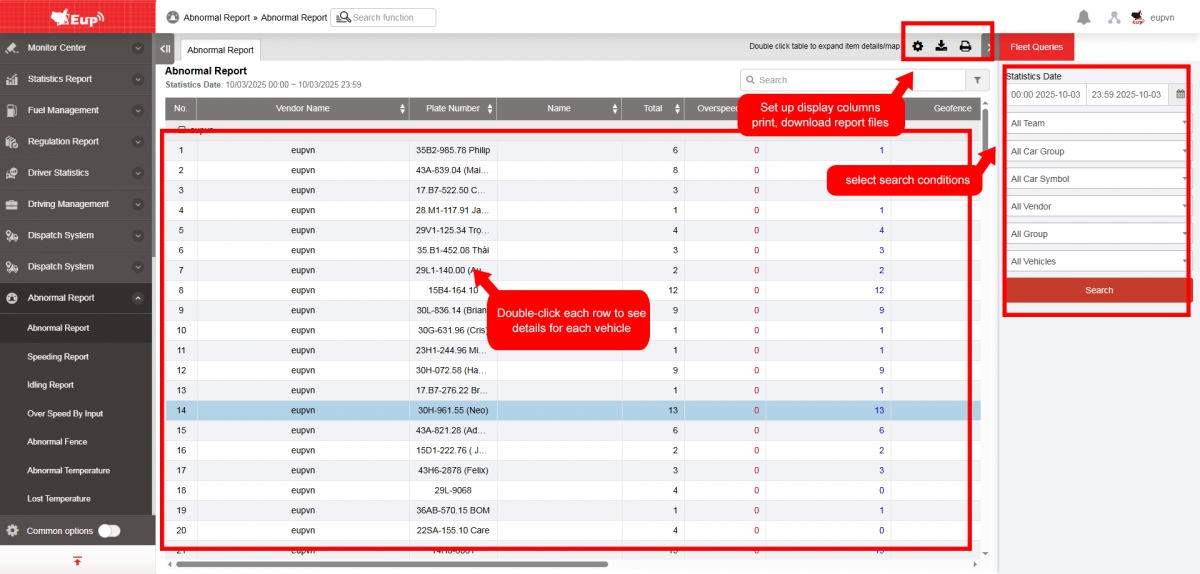
+ Fleet Queries section: the user selects the following information:
-
From: The user enters the first day to create the report;
-
To: The user selects the last day to create the report;
-
Select the icon
 to select the Team;
 -
Click Search button to display the report in the Report Details section.
+ Report details section: Display detailed report information.
-
Plate number;
-
Driver;
-
Total: Total number of violations = Speeding + Idling + Abnormal obstacles + Abnormal temperature;
-
Overspeeding: Count the number of times exceeding the speed limit;
-
Idling (Stopping without turning off the engine): Count the number of times the vehicle stops without turning off the engine (Speeding alerts separated by >=60s are counted as separate instances);
-
Geofence: Count the number of times the vehicle encounters abnormal obstacles;
-
Abnormal temperature: Count the number of times the vehicle has abnormal temperature;
-
Behavior report: Count the number of times the vehicle suddenly accelerates or decelerates;
-
Sharp turn: Count the number of emergency U-turns;
-
Users can click on a row to view detailed information about the time and location of the vehicle's abnormal activity,...

+ Select the icon  to print the report
+ Select the icon  to download the report as excel
+ Select the icon  to Custom Field, Plate number field settings, Print signature settings
- Log in to post comments
- Tiếng Việt
- 繁體中文