Driver Attendance Table
1. Purpose
- Support users in generating statistics on vehicle speed and U-turn speed in the form of charts.
2. Implementation conditions
- The user is granted permission for the Driver Attendance Table function on the CRM system.
3. Implementation instructions
- Driver Statistics»Driver Attendance Table

- The function screen consists of 2 sections:
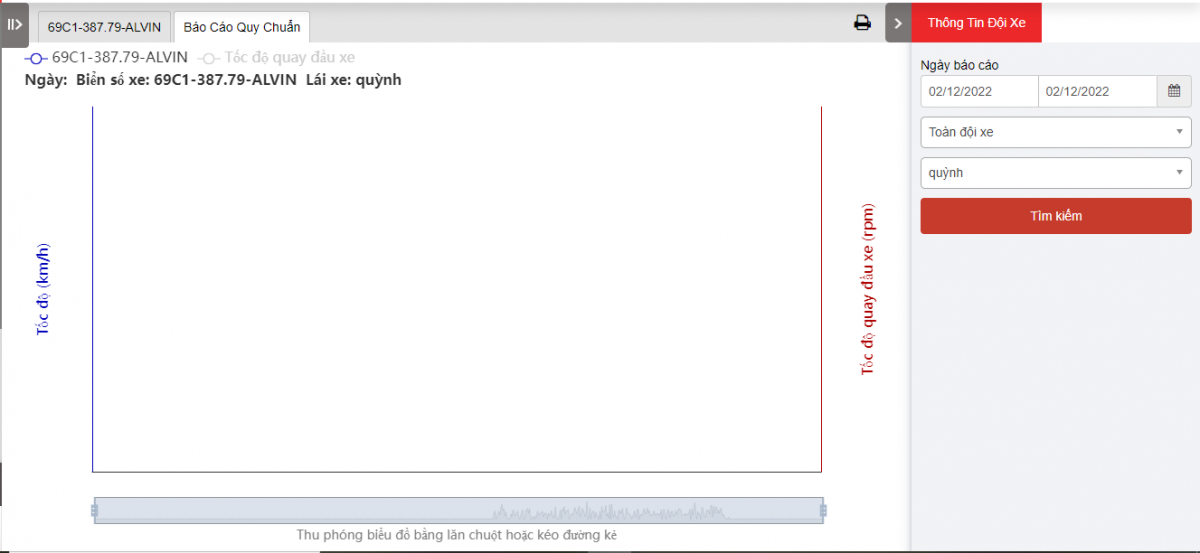
+ Fleet Queries Section: Allows users to select the time period, vehicle team, and driver for viewing the report.
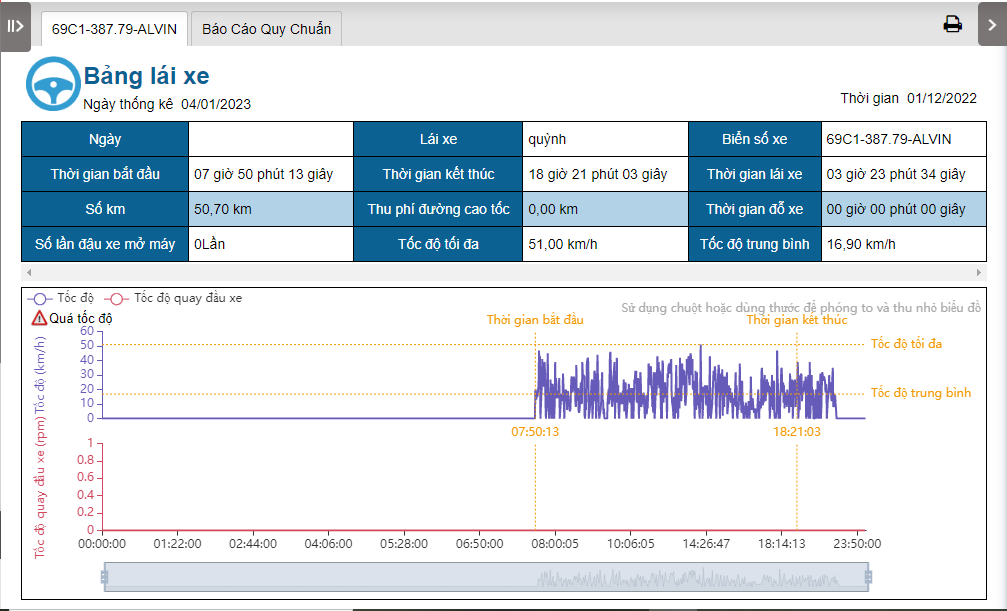
+ Driver Attendance TableSection: Allows users to view statistical reports including driving time, kilometers traveled, highway toll fees, parking time, number of idling instances, maximum speed, average speed, and charts for Speed and Vehicle U-Turn Speed.
+ Regulation tachograph Section: Includes charts for Speed and Vehicle U-Turn Speed.

+ Fleet Queries section: the user selects the following information:
-
From: The user enters the first day to create the report;
-
To: The user selects the last day to create the report;
-
Select the icon
 to select the Team;
 -
Click Search button to display the report in the Report Details section.
+ Report details section: Display detailed report information.
-
Date;
-
Driver;
-
Plate number;
-
Start Time: The time the driver begins driving.
-
End Time: The time the driver stops driving.
-
Driving Time: The duration from when the vehicle starts moving to when it stops.
-
Total Mileage: The distance traveled.
-
Highway toll mileage: Fees incurred for highway usage.
-
Stop time: The duration the vehicle is parked.
-
Turn off the number of stops: The number of times the vehicle is parked with the engine running.
-
Maximum Speed: The highest speed recorded.
-
Average Speed: The average speed during the trip.
-
Speed and Vehicle U-Turn Speed Statistical Chart: A chart displaying speed and U-turn speed statistics.
-
Speed Details: Overspeed instances, start time, end time, maximum speed, average speed.
-
Vehicle U-Turn Speed: The speed at which the vehicle performs U-turns.
-
Speed Details: Overspeed instances, start time, end time, maximum speed, average speed.
-
Vehicle U-Turn Speed: The speed at which the vehicle performs U-turns.
-
+ Standard Report Section: Charts
-
Speed
-
Vehicle U-Turn Speed
-
To zoom the map: Scroll the mouse wheel or drag the slider.

- Log in to post comments
- Tiếng Việt
- 繁體中文