Map
1. Purpose
- Support users to check vehicle operating status on the map and detailed information of each vehicle updated at the current time.
2. Implementation conditions
- Users are given a journey monitoring system account.
3. Implementation instructions
- Step 1: Go to menu Monitor center/Map
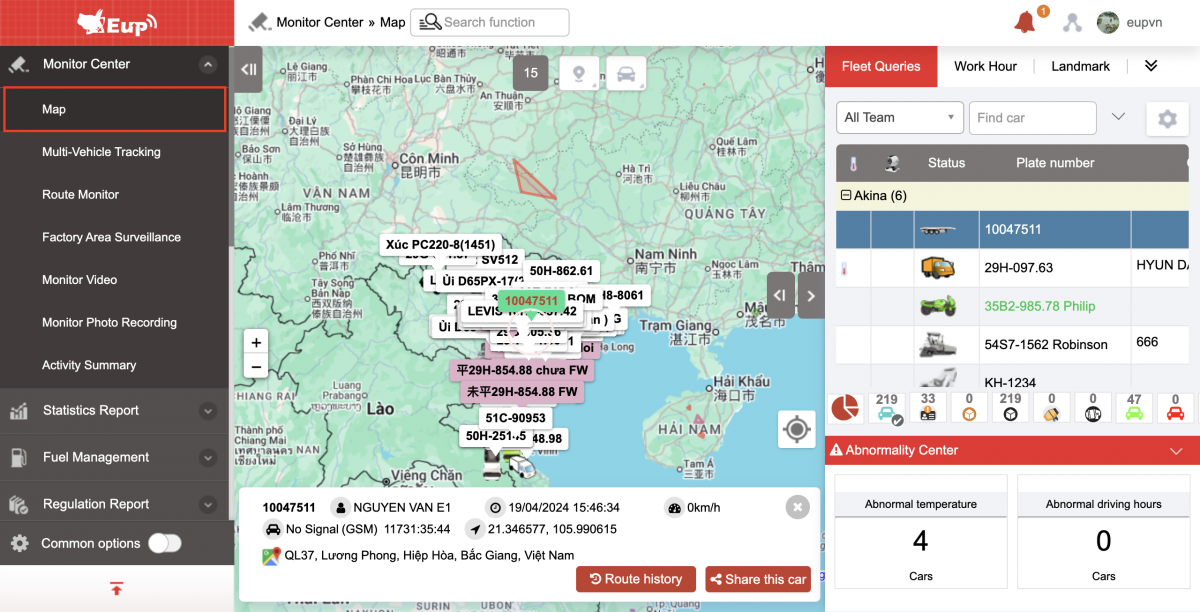 - Step 2: The function display screen consists of 2 parts:
+ Fleet queries: displays information about the fleet, nearby vehicles, landmarks and restricted areas;
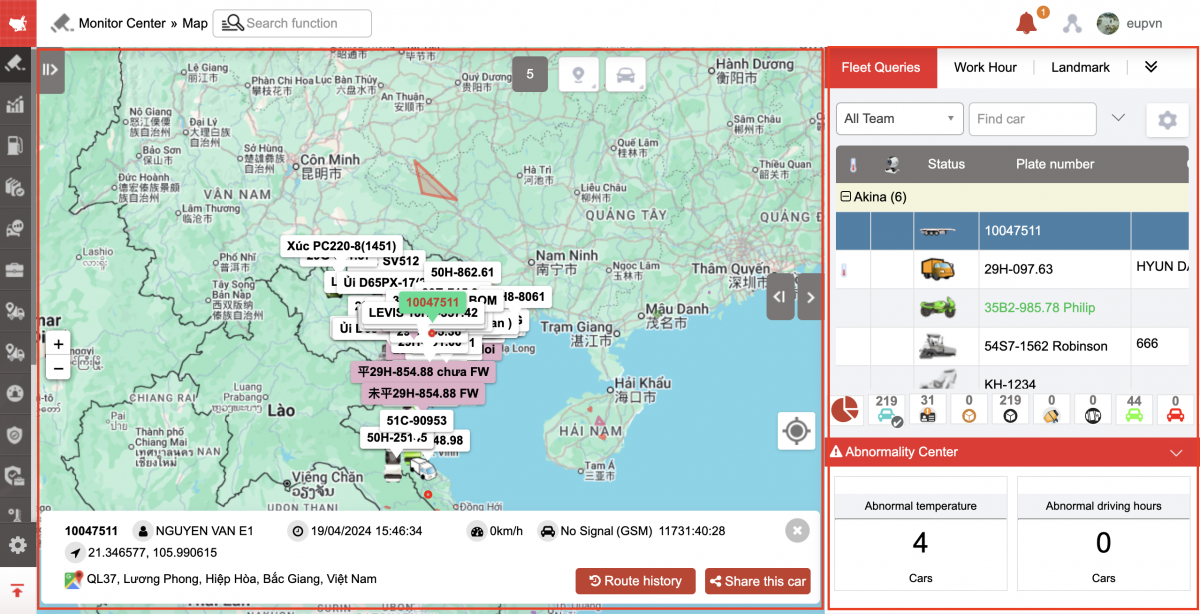
+ The map displays the selected vehicle on the map so that users have a visual view of the current vehicle operating status.
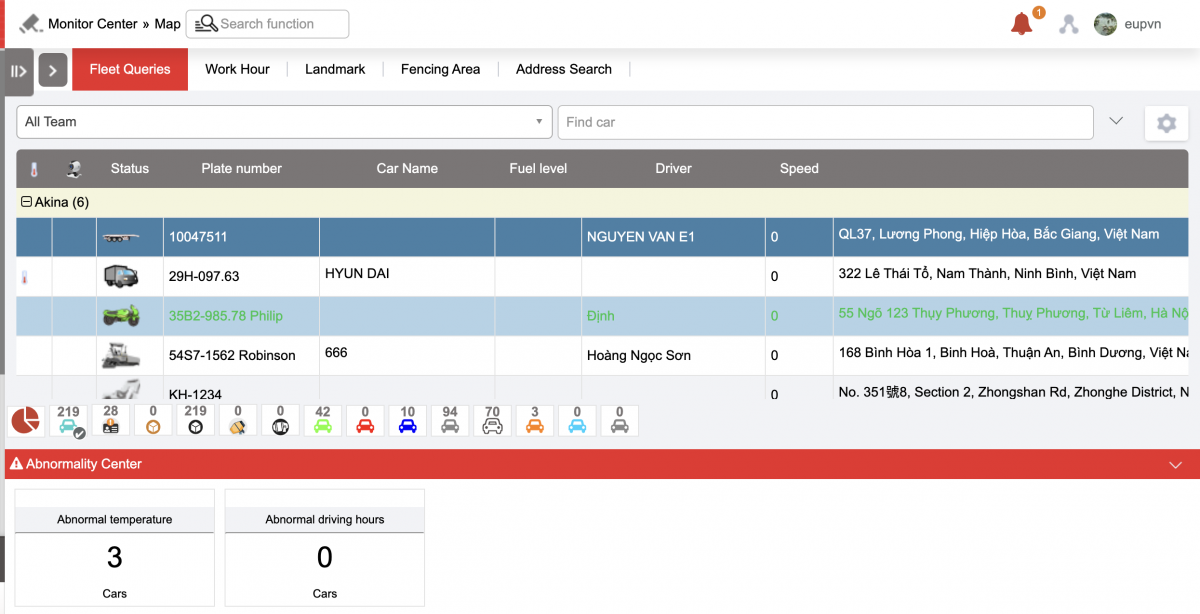
- Fleet queries part: displays information: Fleet Information, Landmarks, Restricted Areas, Address Search
+ Fleet information: Allows you to choose to view information of all fleets or each fleet. Fleet information includes the following information:
-
Filter includes:
-
Choose to view by fleet or view all (Fleet is set in Settings/Permissions)
-
Enter the license plate number you want to view
-
Choose to view by vehicle group or view all (Vehicle groups are set in the Vehicle Group Settings tab on the Settings/Vehicle Groups and Sharing page)
-
Select to view by vehicle type (Vehicle type is set in the Vehicle Icon section in Settings/Basic Information Settings/Vehicle Information
-
-
Report current vehicle status:
-
Status: Display vehicles by color;
-
Speed: Updates the current speed of the vehicle;
-
Plate number;
-
Fuel Level: Update the remaining oil level of each vehicle;
-
Driver: Driver name;
-
Address: Location where the speed update is taking place/ Landmark
-
Reporting time;
-
Phone" Driver's contact phone number.
-
Driving time: Total time in the Running and Stopped states without turning off the engine at the last start (Stopped Vehicle resets the time = 0)
-
-
The support toolbar displays the total number of vehicles according to each status :

-
 : Total
 -
 : Carrying goods (With sensor installed)
 -
 : No cargo (With sensor installed)
 -
 : Mixing (With sensor installed)
 -
 : Discharge (With sensor installed)
 -
 Green: Vehicle is running
 -
 Red: Over speed
 -
 Dark green: Stop the car without turning off the engine
 -
 Gray: Stop
 -
 White: Signal lost
 -
 Purple: Active (Sensor installed)
 -
 Orange: Abnormal temperature (Sensor installed)
 -
 Blue: Abnormal barriers (Set in Settings/Self-build restricted area)
 -
 Gray: Container removal (Container with GPS device installed)
-
-
Abnormality Center : Displays the corresponding abnormal status of each selected vehicle (Abnormalities are set at Settings/Alert settings );
-
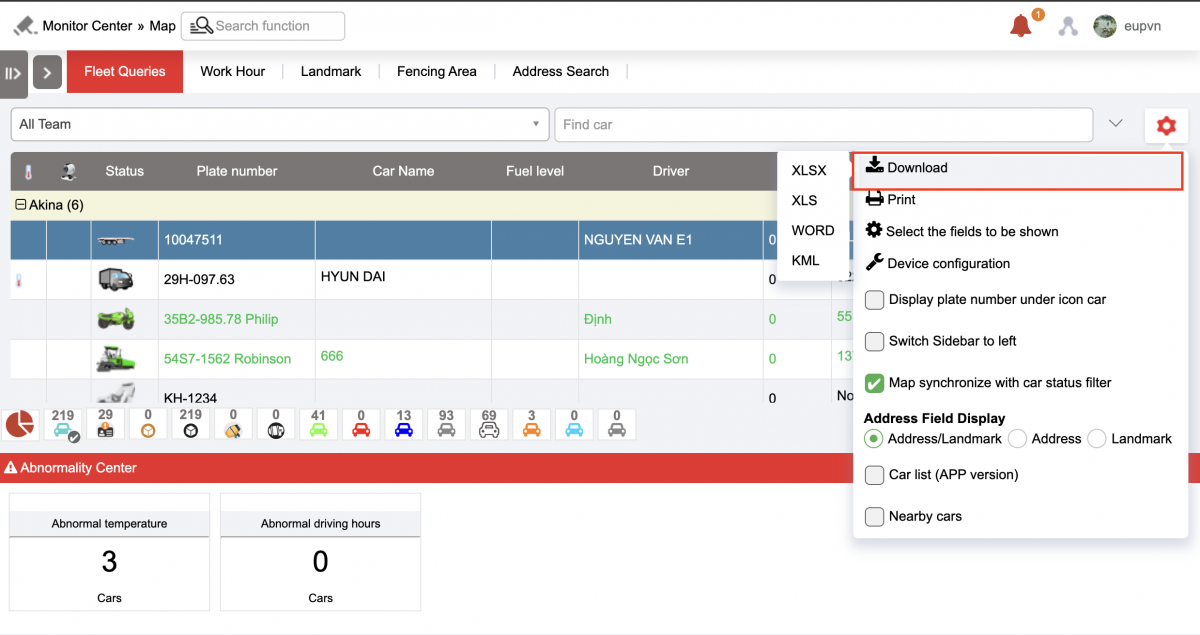
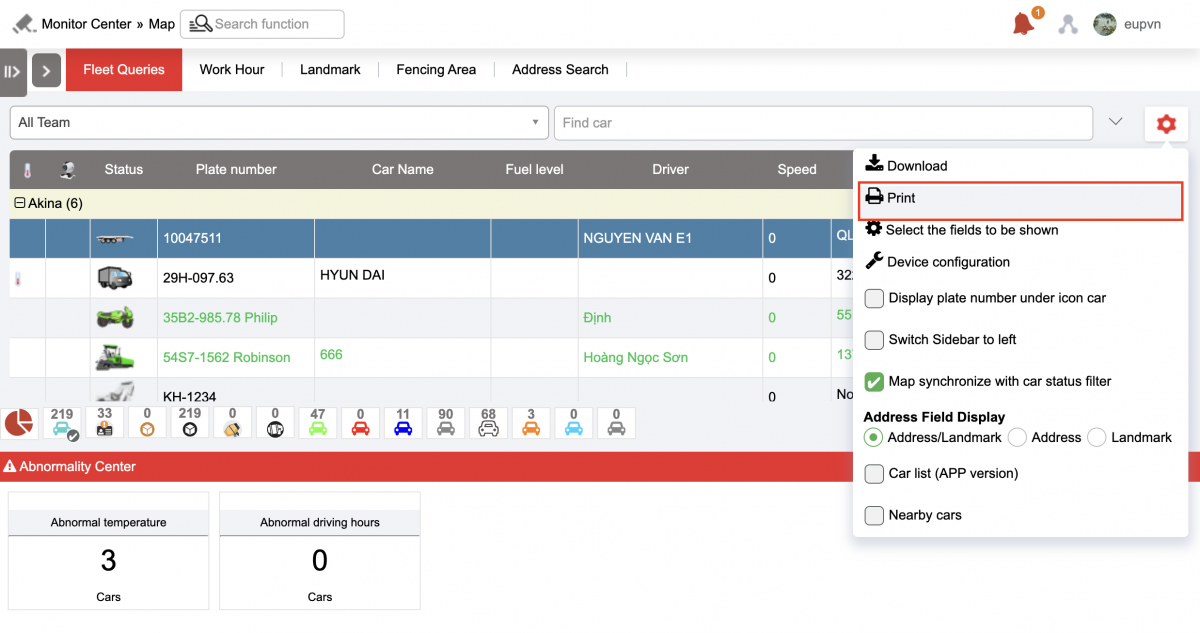
Click Download to download a summary report of the entire fleet's vehicle status during the report download period: Download in XLSX/ XLS/ Word format
-
Click Print to print the current status report;
-
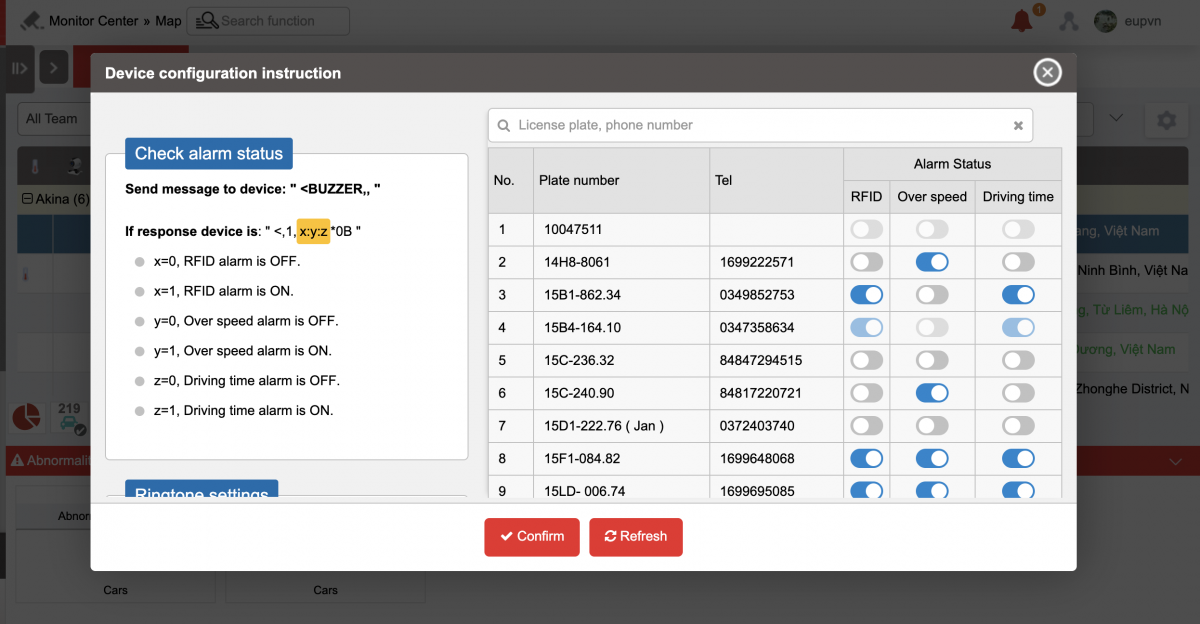
Device configuration instruction: Set on/off the card swipe/ Overspeed/ Driving time bell status
-
Slide to left (Gray display button): Turn off the bell
-
Swipe right (Blue display button): Turn on the bell
-
-
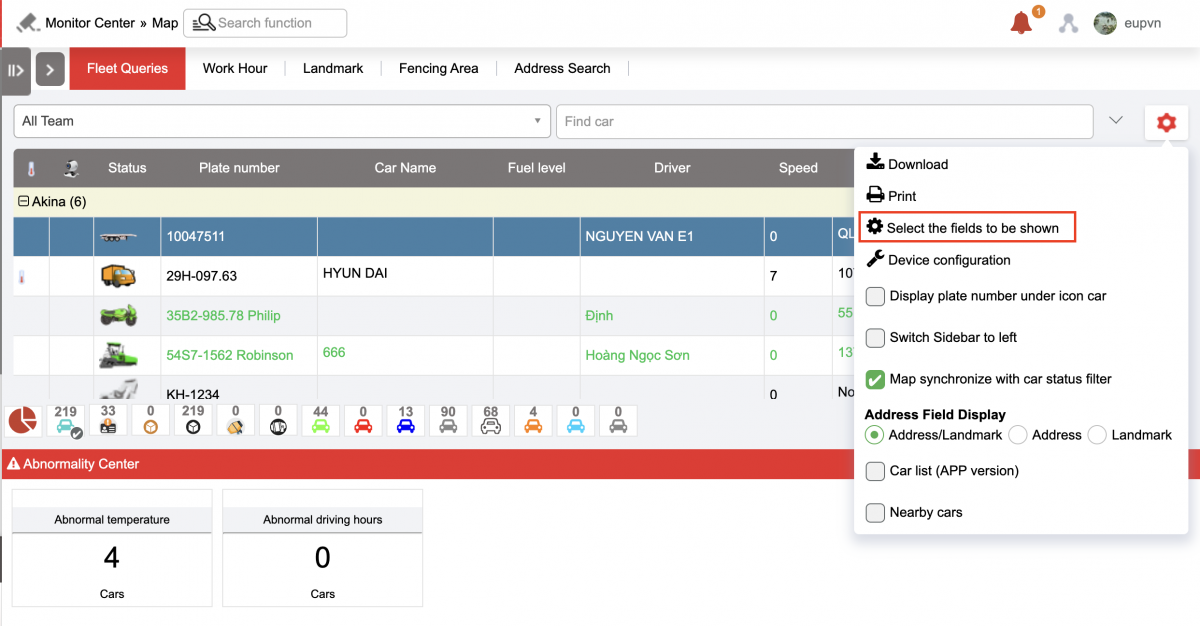
Click Select fields to display to be shown to set the fields of the current status report to show or hide;
-
When checking Nearby cars: Display vehicles within the map range in the Fleet queries

-
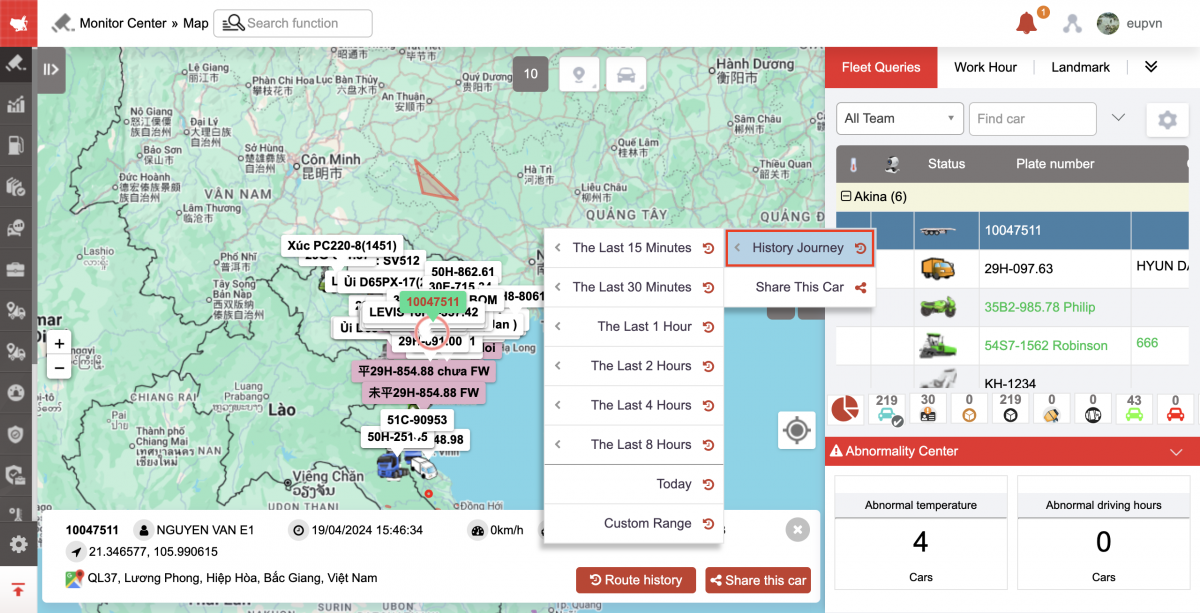
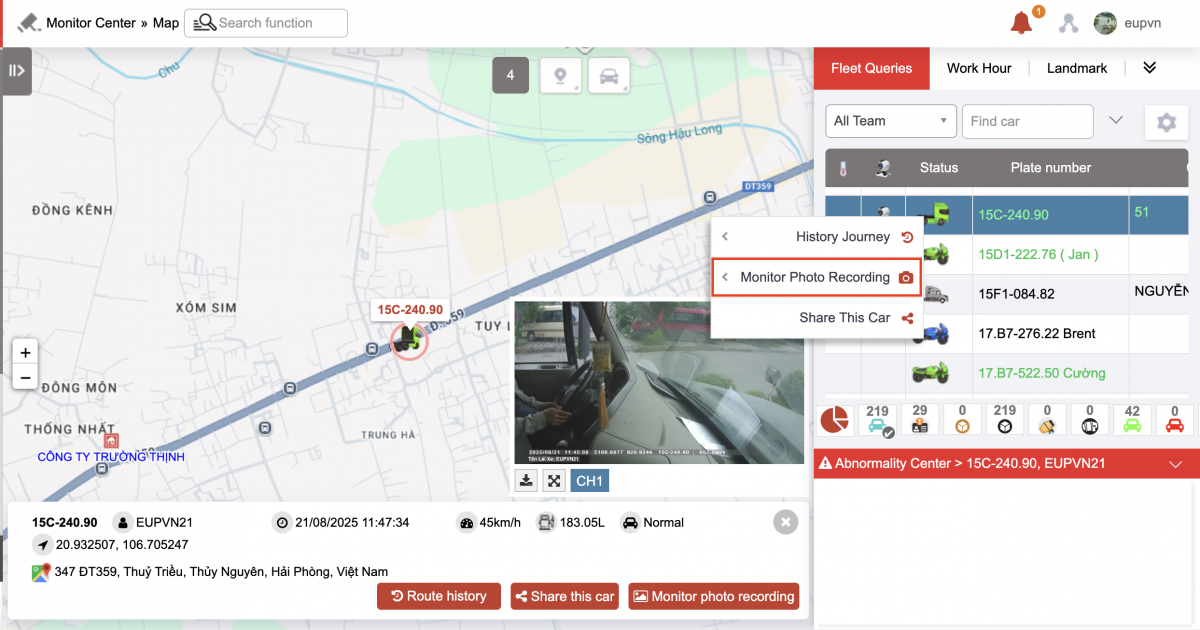
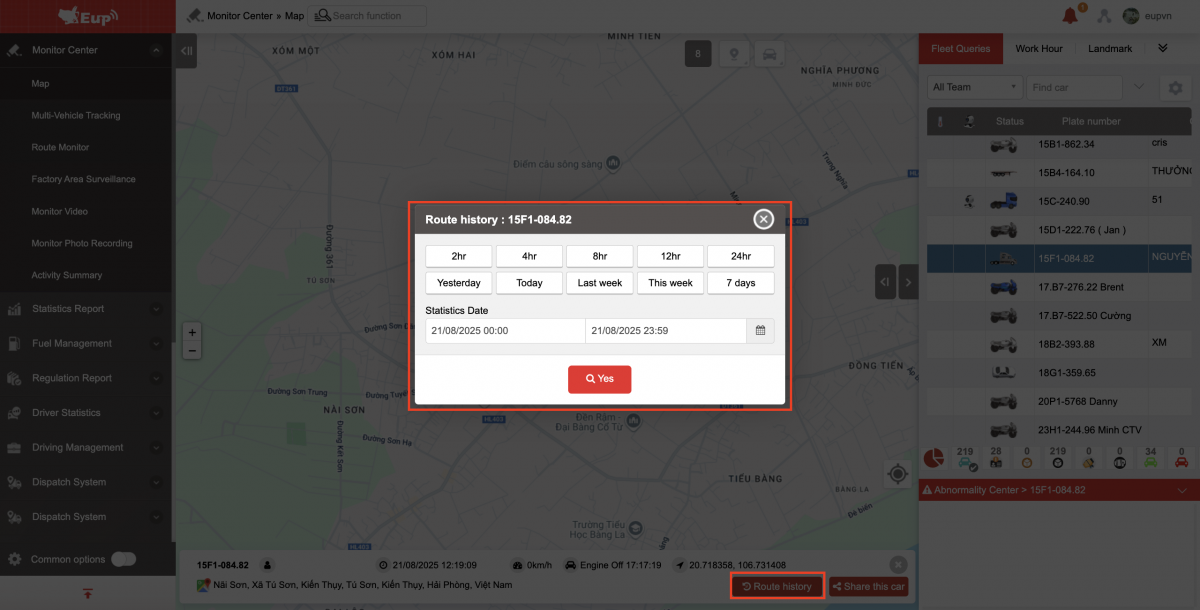
Select vehicle/ Right click: Quickly view history journey by recent 15 minute/30 minute/1 hour/2 hour intervals..., During the day, Optional.
-
Monitor photo recording: Quick view of camera images 1,2
-
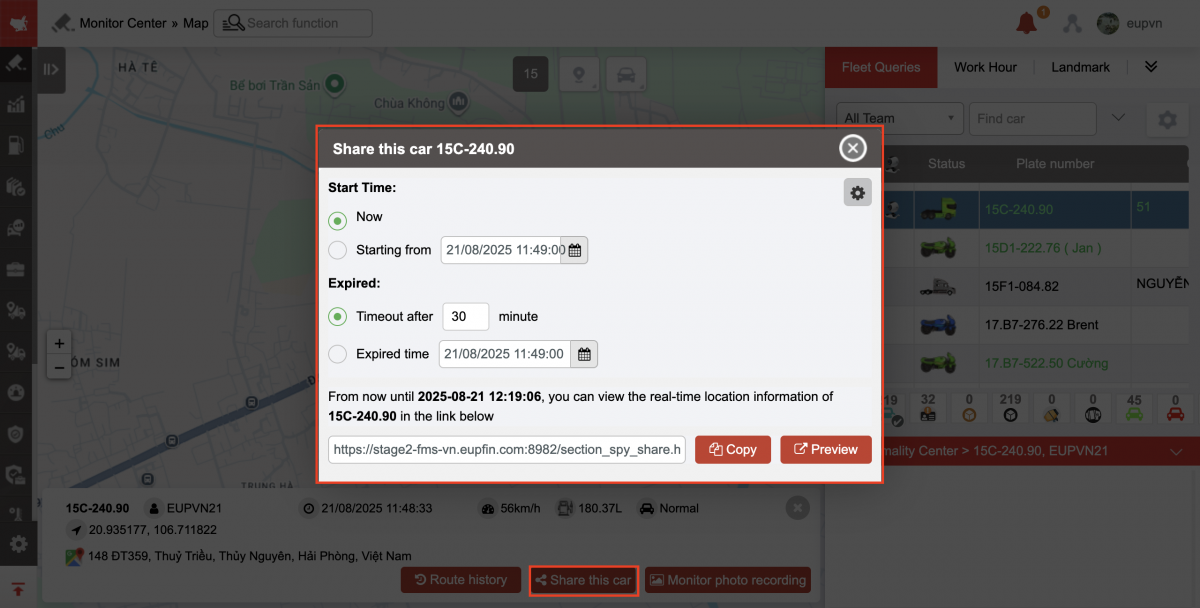
Share this car: share the location of the selected car
-
Step 1: Right click on the car, then click share car on the map (Or select the car to share, select the Share car button at the bottom of the map)
-
Step 2: Display the car sharing board with the following information:
-
Timeout after: Number of minutes the link expires
-
Expired time: Share link expiration time
-
Show/hide landmarks: Allow sharing of landmarks or not
-
Select the button
 to customize on/off the information fields you want to share and save.
 -
At the car sharing link: select copy or preview
-
-
Step 3: Send car sharing link
-
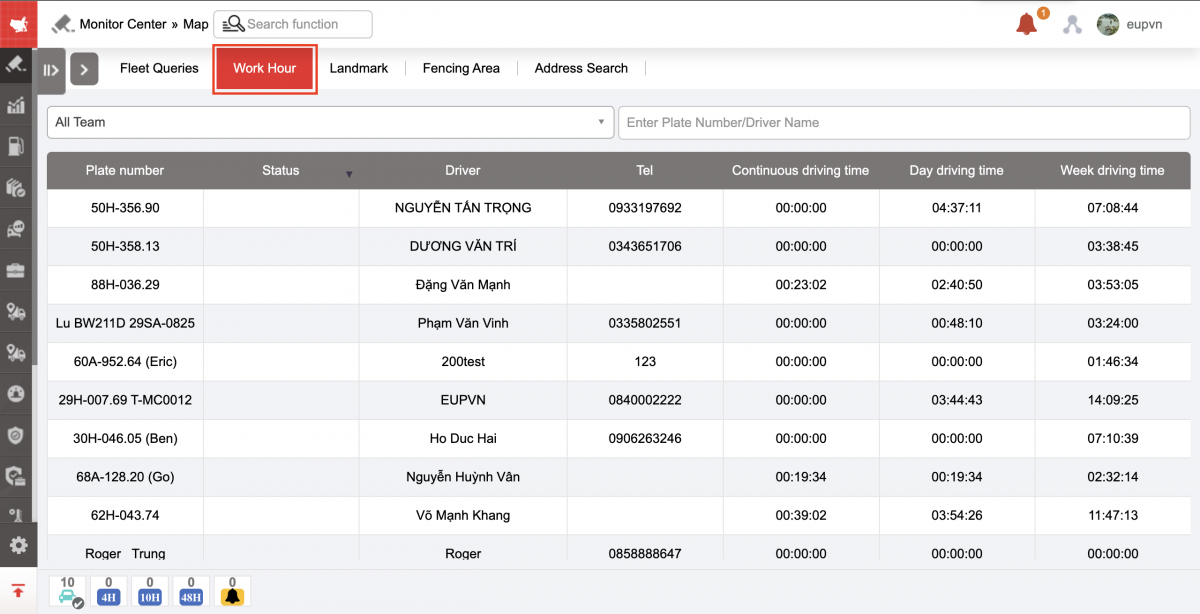
+ Work hour:
-
Plate number:
-
Status: Current status of the vehicle
-
Driver: Driver swiping card
-
: Driver's phone number
-
Continuous driving time: Total continuous driving time 4 hours (According to QCVN)
-
Day driving: Total driving time per day 10 hours/day (According to QCVN)
-
Week driving time: Total driving time per week 48 hours/week (According to QCVN)
-
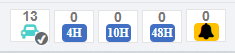
Vehicle Icon: Show total vehicles
-
Violation icon 4h, 10h, 48h: Displays the number of vehicles with drivers violating driving time
-
Bell icon: Displays warning of violating drivers

-
If the driver is about to violate the driving time, it will be colored yellow, if he has violated, it will be colored red.
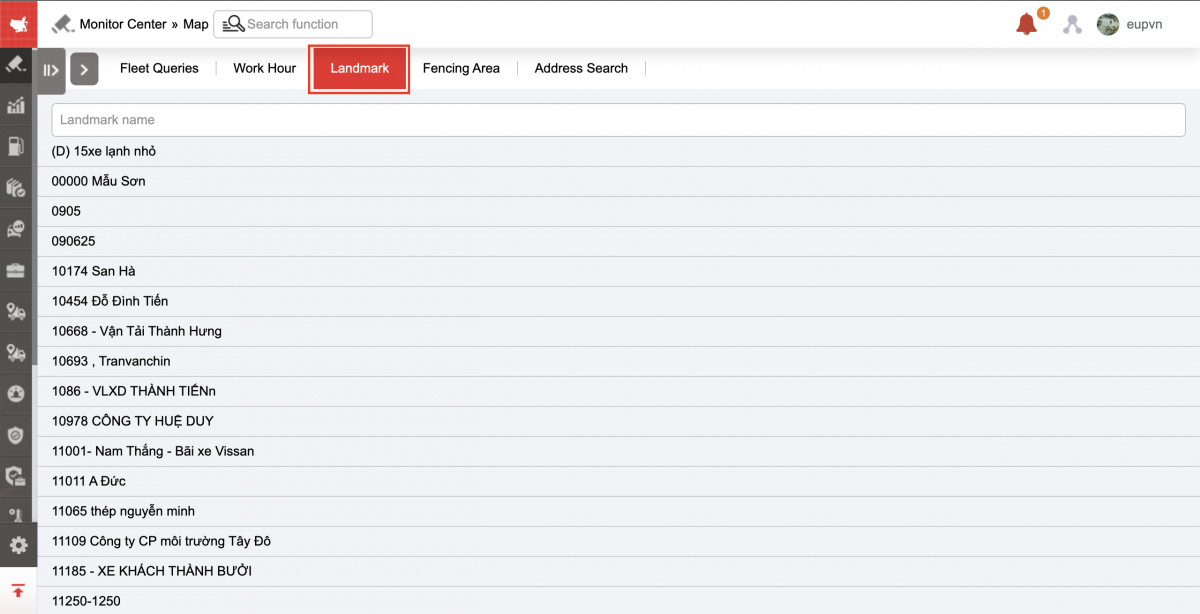
+ Landmark : Display pre-set milestones for fleets to track fixed counting points that vehicles are set to pass through;
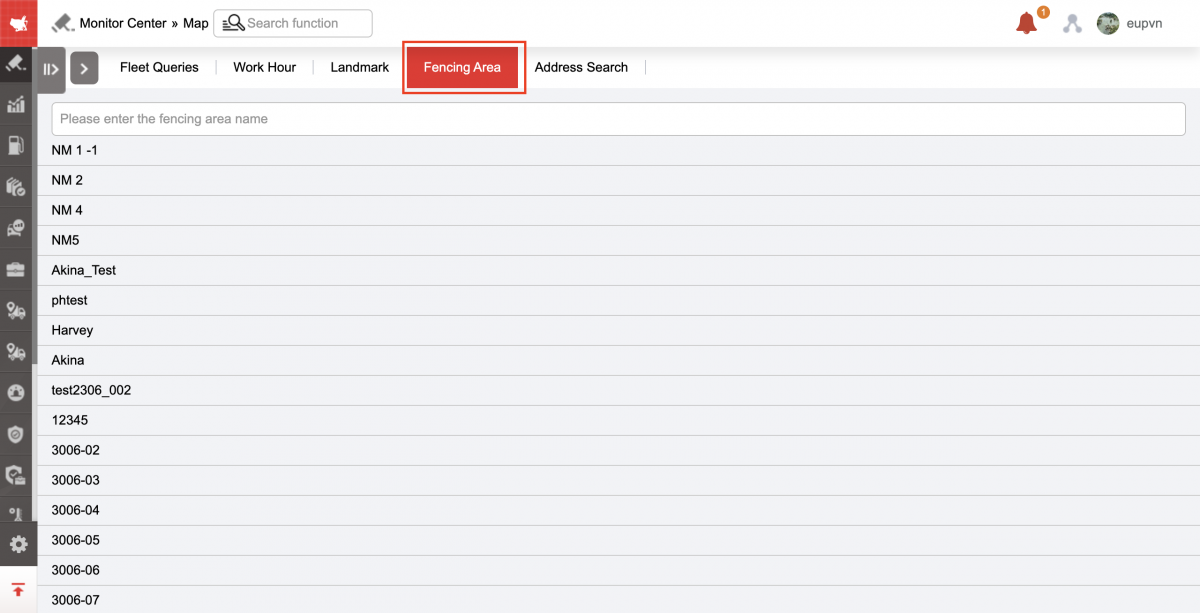
+ Fencing area : Displays pre-set restricted areas for each vehicle, to monitor vehicles that are only allowed to run within the restricted area.
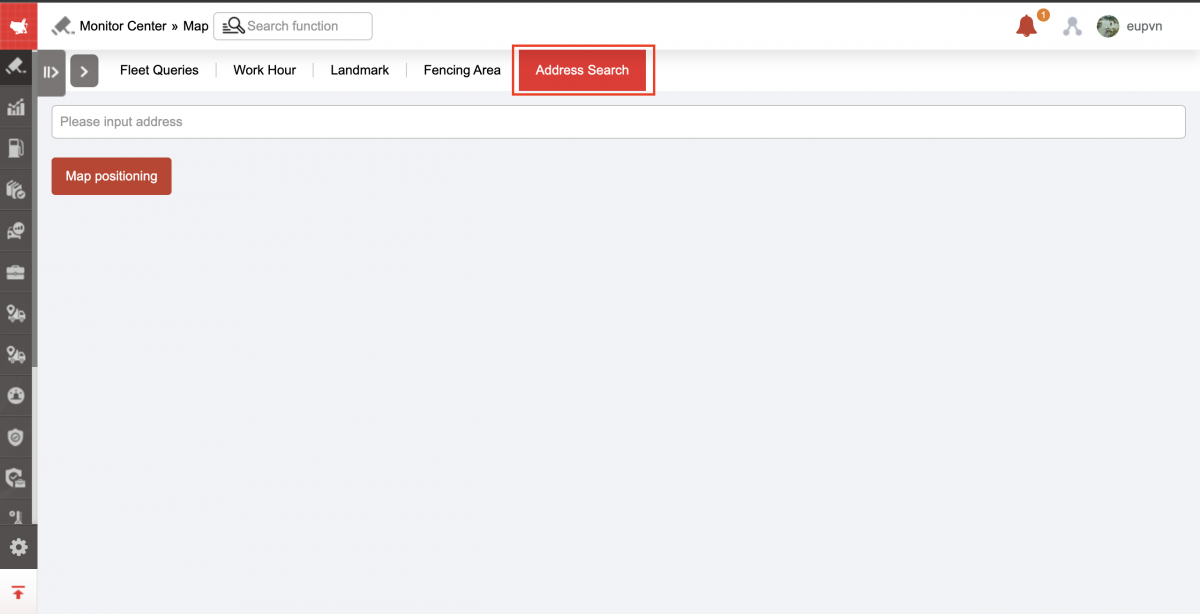
+ Address search
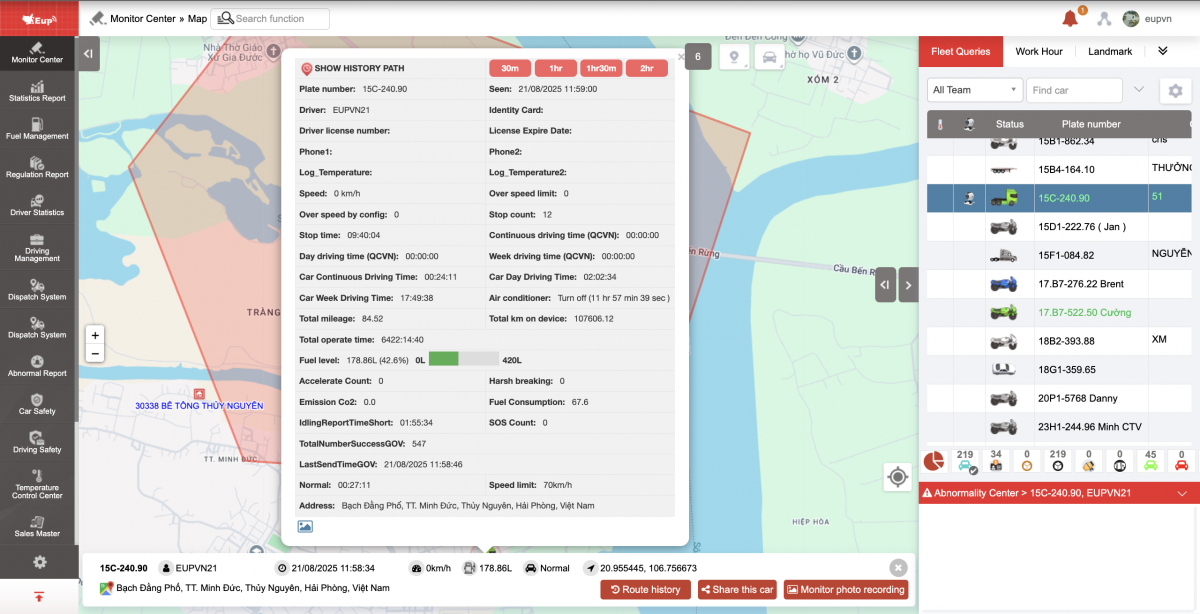
- Map section : Displays the vehicle's location on the map and the current vehicle status. Users can point the mouse at the vehicle to view detailed information. In addition, users can right-click to quickly create landmarks or restricted areas.
-
Over speed by : Number of times exceeding the speed limit per day (Speed limit is set in Over speed in Settings/Warning settings/Vehicle status)
-
Stop count : Number of times the vehicle was stopped without turning off the engine and parked during the day
-
Stop time: Accumulated parking time during the day (total parking time with engine off + parking time without engine off during the day);
-
Car Continuous Driving Time: : The time the vehicle is in continuous driving state at the most recent time (statistics by vehicle)
-
Car Day Driving Time: Total time the vehicle is in running condition during the day (Statistics by vehicle)
-
Total mileage : Total km the vehicle travels during the day
-
Maximum Load (Tons): Displays the maximum load set at Settings/Basic Information/Vehicle Information
-
Custom: Displays the content entered in Settings/Basic information/Vehicle information. The content is the vehicle's hotline phone number or any information the user wants to display on the vehicle information board.
-
Total km on device: Total km from installation to present time
-
Total operate time:
-
Accelerate Count:
-
Decelerate Count::
-
CO2 emissions (grCo2):
-
Fuel level (liters):
-
DXKTM time: Time of stopping the vehicle without turning off the engine during the day
-
SOS count: Number of SOS button presses per day
-
Total Number Success GOV:: Number of messages transmitted to TCDB during the day
-
Last Send Time GOV: Displays the time of data transmission to TCDB
-
Speed limit: is the speed limit according to the route, according to option VN08 and must setVehicle Type (Toll station/Maximum speed management) in Settings/Basic information/Vehicle information
-
Air conditioner:: Displays the status and total time in the corresponding state of IO2 up to now
-
Car Day Driving Time: Total time of drivers running per day.
For example : Driver A drives for 4 hours, driver B drives for 3 hours, then the driving time in a day is 7 hours.
-
Current state : Accumulated time of discharge/mixing operating states, total time of maintaining the current state of the vehicle. For example: Discharge/mixing:00:01:00, Vehicle running : Accumulated time of discharge/mixing operating states, accumulated time of the current state of the vehicle (parking, stopping without turning off the engine, running vehicle)
-
Address: Shows the current location of the vehicle
+ Right click on the online map:
-
Navigate in Google Map: Go to Google Map search current location to click location on map
-
View point in Google Map: View click location on map directly on Google Map
-
Direct: Search from Click location on map to another location
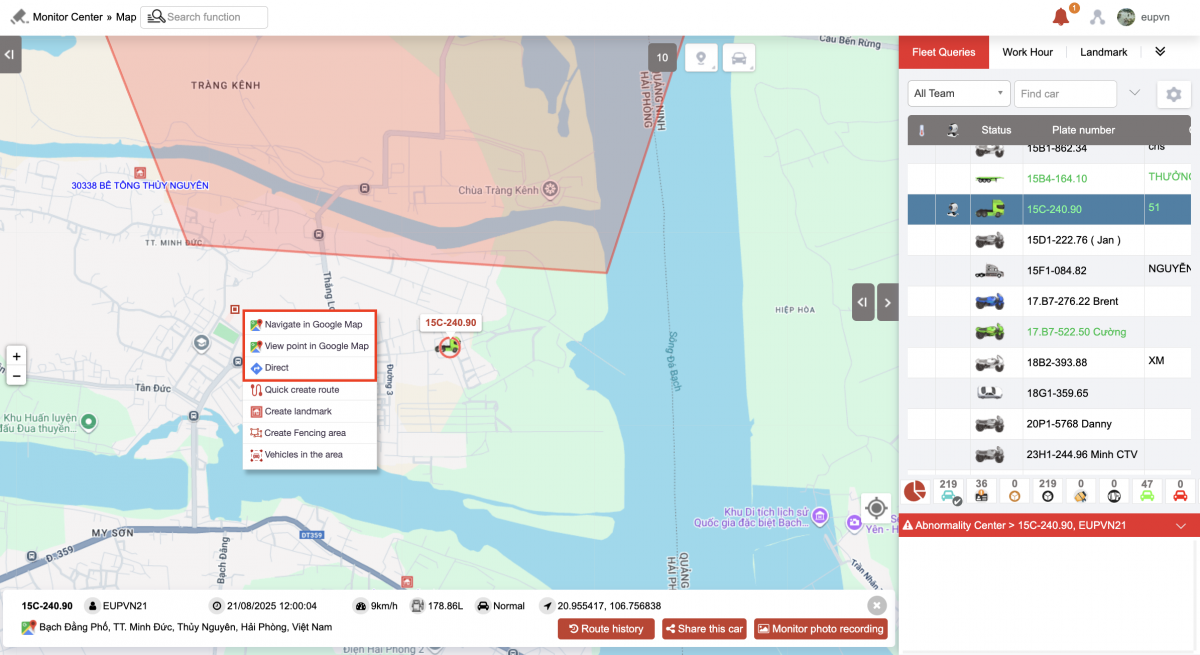
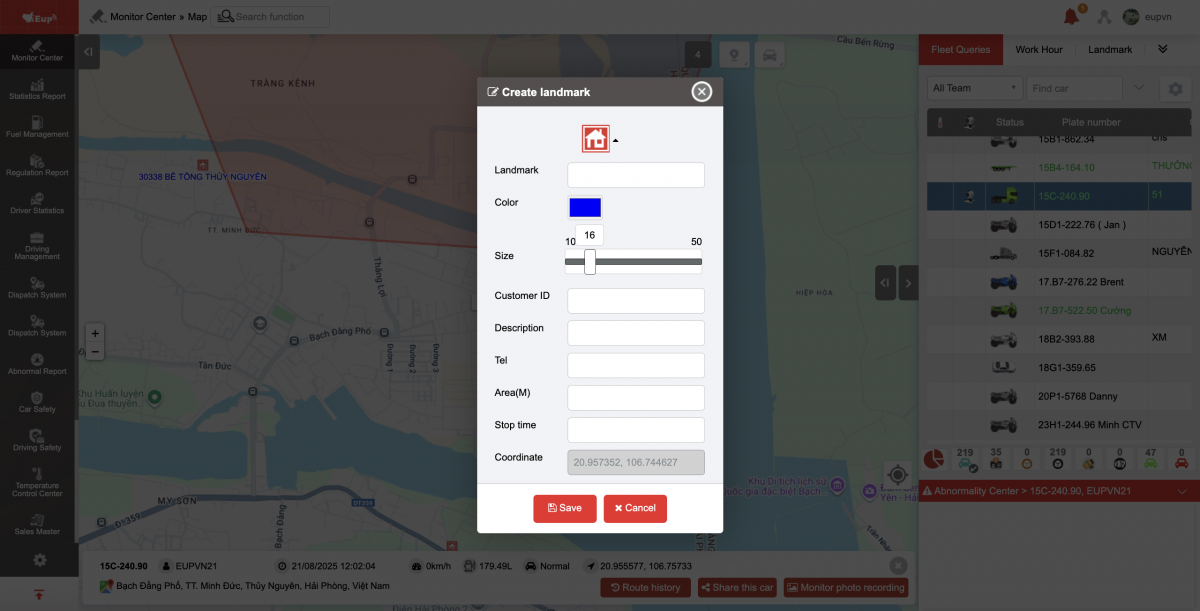
+ Create a landmark by right-clicking on the map: Name, color: select the landmark text color (default color is blue), size: select the landmark size (default size is 16), customer ID, Description, Tel, Area (M): Landmark radius, Stop time: Settings for the Journey Management function, Coordinate: Display the coordinates of that milestone when adding and editing, Subsidiary branch: whether to share with authorized accounts or not
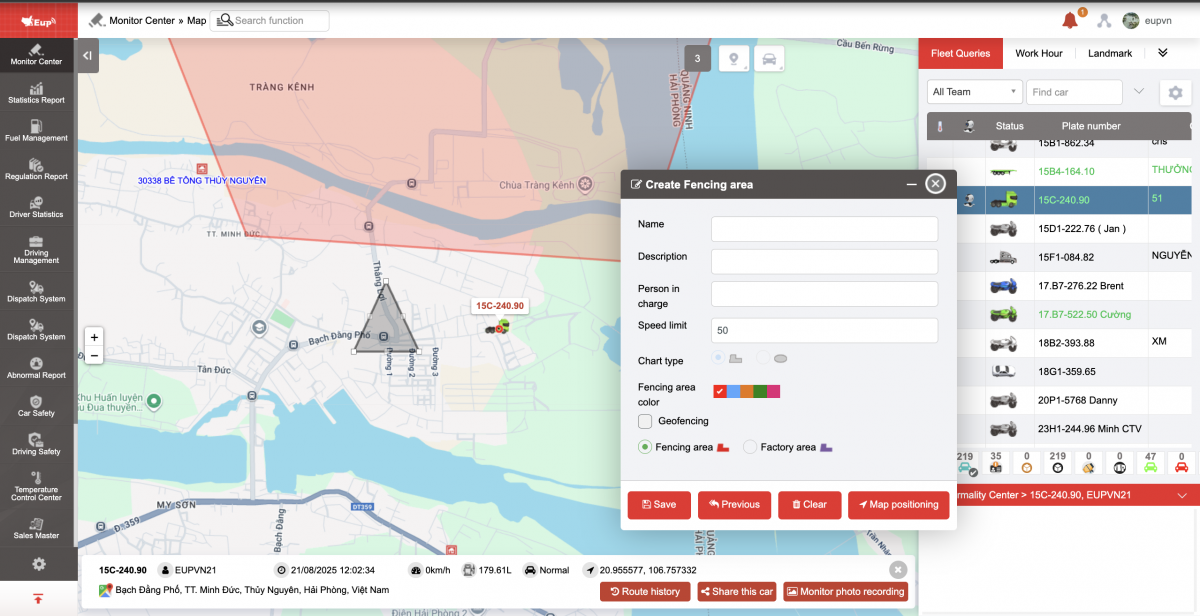
+ Create a fencing area by right-clicking on the map/ Fill in the information: Name, Description, Person in charge, Speed limit, Chart type ![]()
![]() , Fencing area color, Turn on/off geofencing
, Fencing area color, Turn on/off geofencing
-
Fencing area: Zoned
-
Factory area: Create workshop in Online Monitoring/Workshop Monitoring
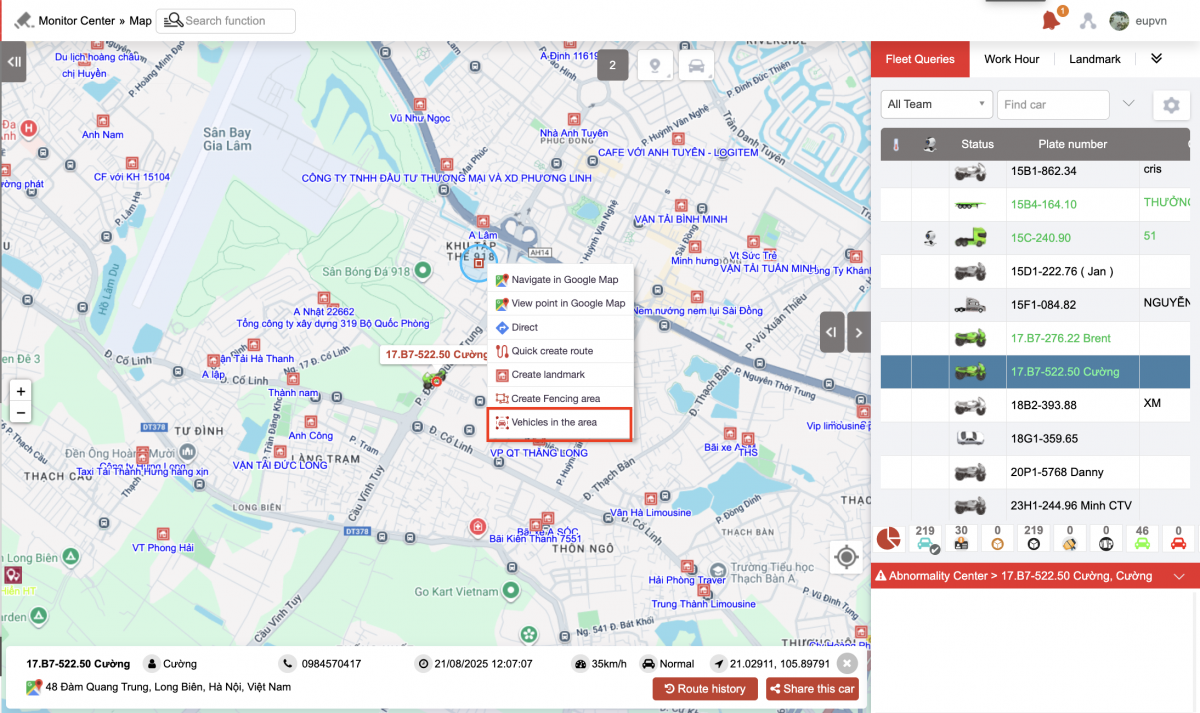
+ Vehicles in the area: The purpose is for users to draw an area and view a list of vehicles in that area. To use this feature, users perform the following operations:
Step 1: Right click on the screen
Step 2: Select Vehicle in the area
Step 3: Right click on the screen to create an area
Step 4: Point the mouse at the destination when the hand icon changes to a finger pointing icon, then drag and drop the mouse to select the area to create.
After creating the area, a list of vehicles in the created area will be displayed. Users can export the file
Note: User needs to be authorized to use option VN82 on CRM
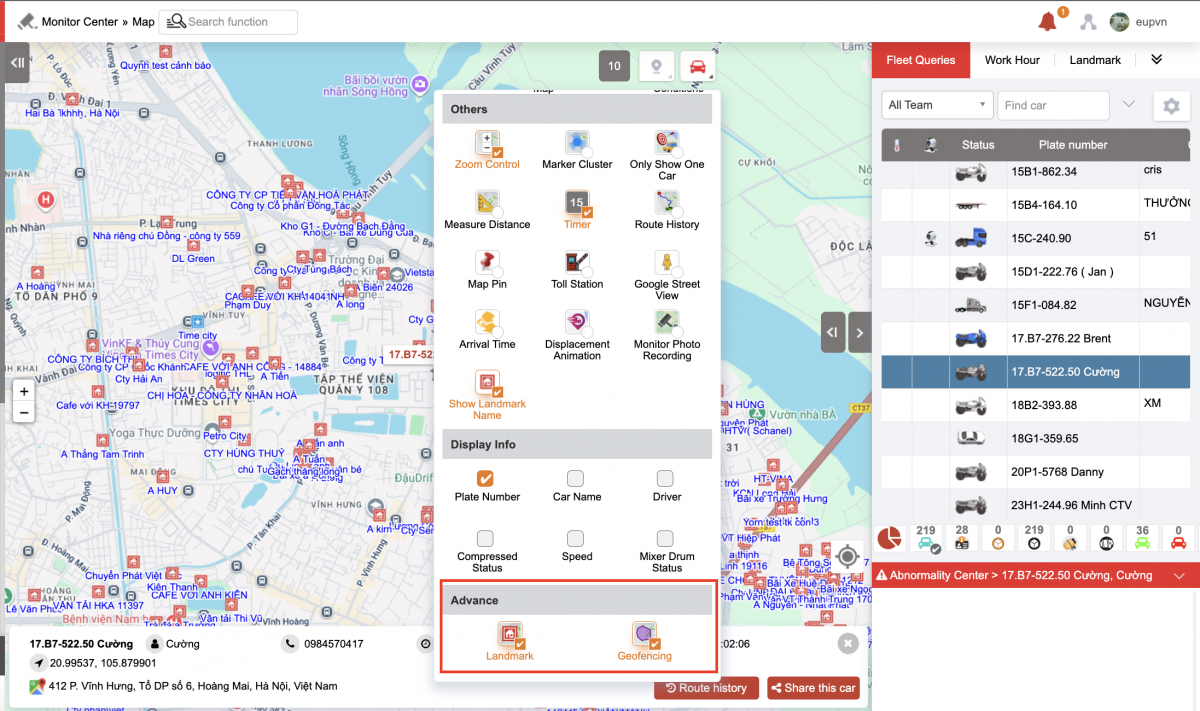
+ Car icon: Map style, Others, Display, Advance
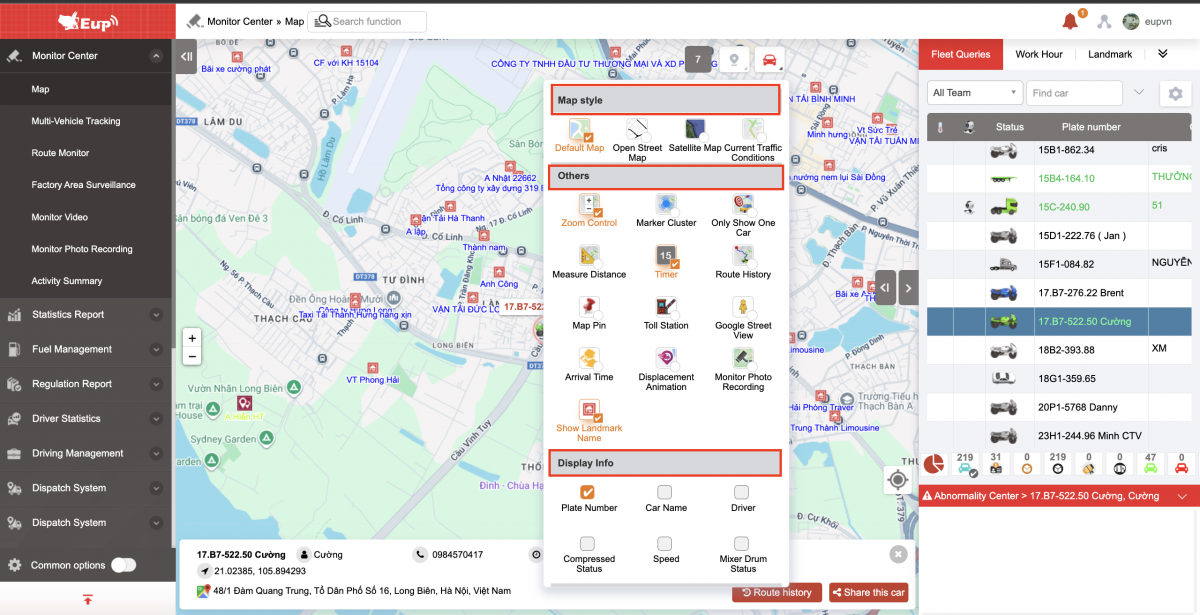
-
Advance checkbox: Landmark checkbox, Geofencing checkbox to enable/disable Landmark and Geofencing on the online monitoring page (Applies to both parent and child accounts)
+ Route history: Select by hour/day/week/option
- Log in to post comments
- Tiếng Việt
- 繁體中文
