Temperature Dashboard
1. Purpose
- Statistics of vehicle temperature by day, week, and month are displayed through charts, helping users visualize and monitor detailed vehicle temperature, especially on days with abnormal temperature readings.
2. Implementation conditions
- The customer uses temperature sensors configured with options 63 and 75.
3. Implementation instructions
- Go to menu Temperature control center/ Temperature Dashboard
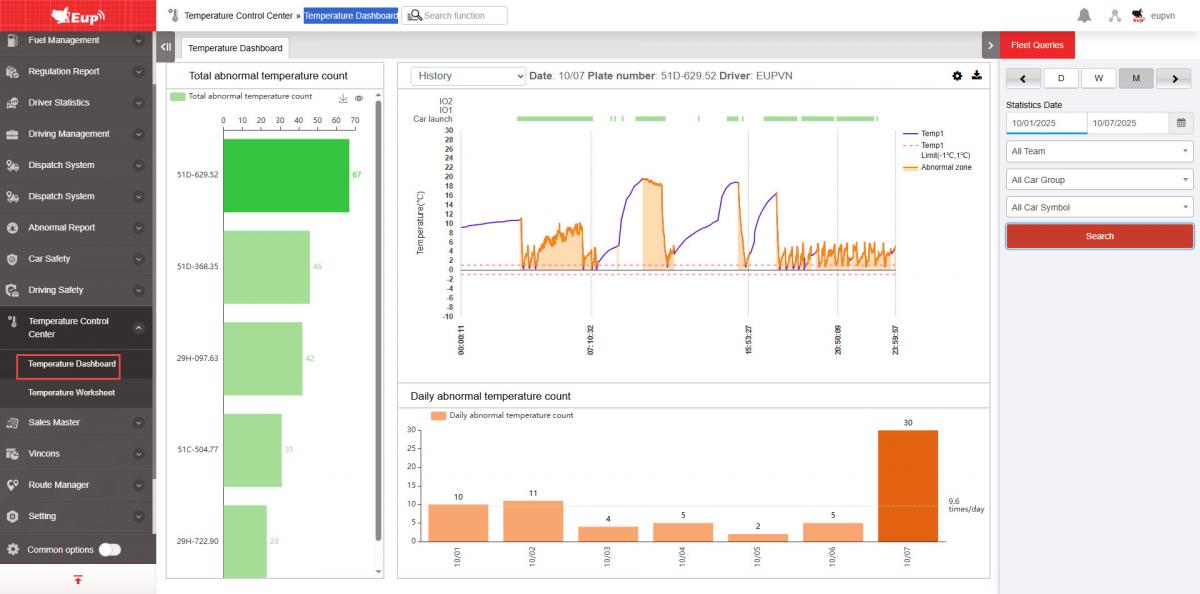
- The functional screen displays four chart sections:
- Section 1 – Total Abnormal Occurrences: A chart showing the number of abnormal temperature occurrences by vehicle within the selected time range.
- Section 2 – Daily Abnormal Temperature Occurrences: A chart showing the number of abnormal temperature events by day.
- Section 3 – Detailed Daily Temperature Graph: A line chart displaying detailed temperature data for each day.
- Section 4 – Fleet Information: Displays information about the vehicle fleet.
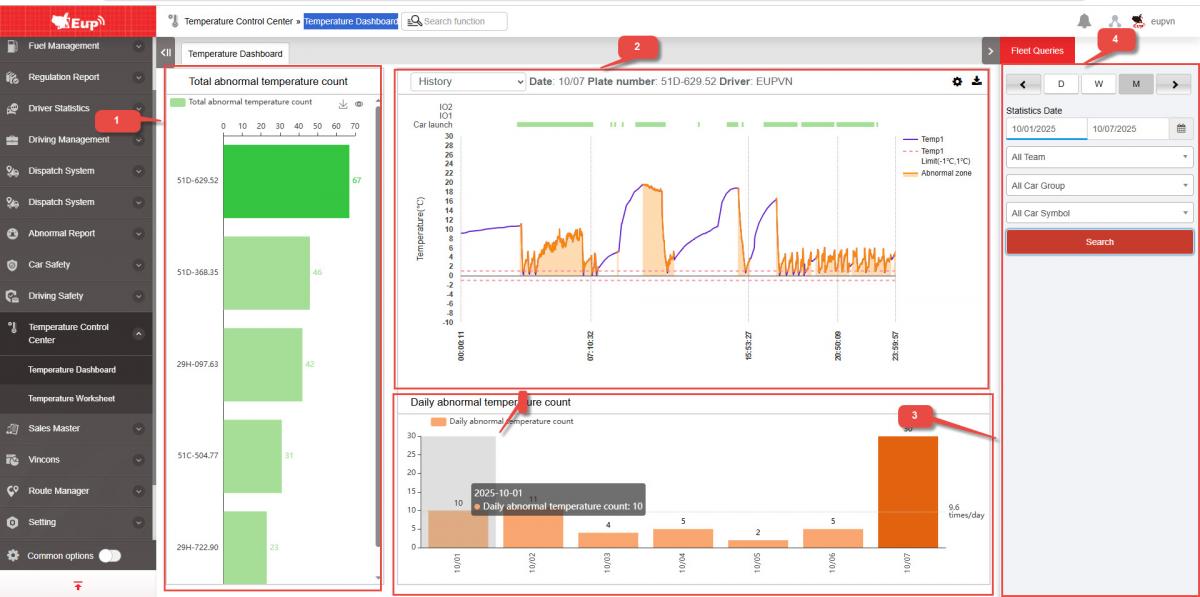
- Section 1 – Total Abnormal Occurrences:
- Supports users by displaying a chart showing how many times each vehicle had abnormal temperature readings within the selected time range.
- To view detailed abnormal occurrences by day, the user clicks on the blue bar of each vehicle in the chart, then views details in Section 2 – Daily Abnormal Temperature Occurrences.
- Section 2 – Daily Abnormal Temperature Occurrences:
-
This is a bar chart that displays the number of abnormal temperature occurrences per day for each vehicle, represented by orange bars.
-
Users can view detailed temperature data for a specific day by clicking on the bar of the desired date, then viewing details in Section 3 – Detailed Daily Temperature Chart of the Vehicle.
-
Choose icon
 download char
- Section 3 – Detailed Daily Temperature Chart of the Vehicle:
- Displays a detailed temperature chart by day for each vehicle.
- When selecting a data point on the chart, full information will be displayed, including temperature, time, and the air conditioner’s ON/OFF status.
- Section 4 – Fleet Information:
- Allows users to select vehicles and a specific time range to generate and print reports.
-
All Vehicles: The user selects the icon to choose all vehicles or specific ones.
-
From: The user selects the starting date and time for the report.
-
To: The user selects the ending date and time for the report.
-
Click Search to display the report in the Detailed Information section.
- Log in to post comments
- Tiếng Việt
- 繁體中文