Abnormal Report
- Log in to post comments
- Tiếng Việt
- 繁體中文
Abnormal Report
1. Purpose
- Support users in aggregating the number of violations by drivers for each type of violation.
2. Implementation conditions
- The user is granted permission for the Abnormal Report function on the CRM system.
3. Implementation instructions
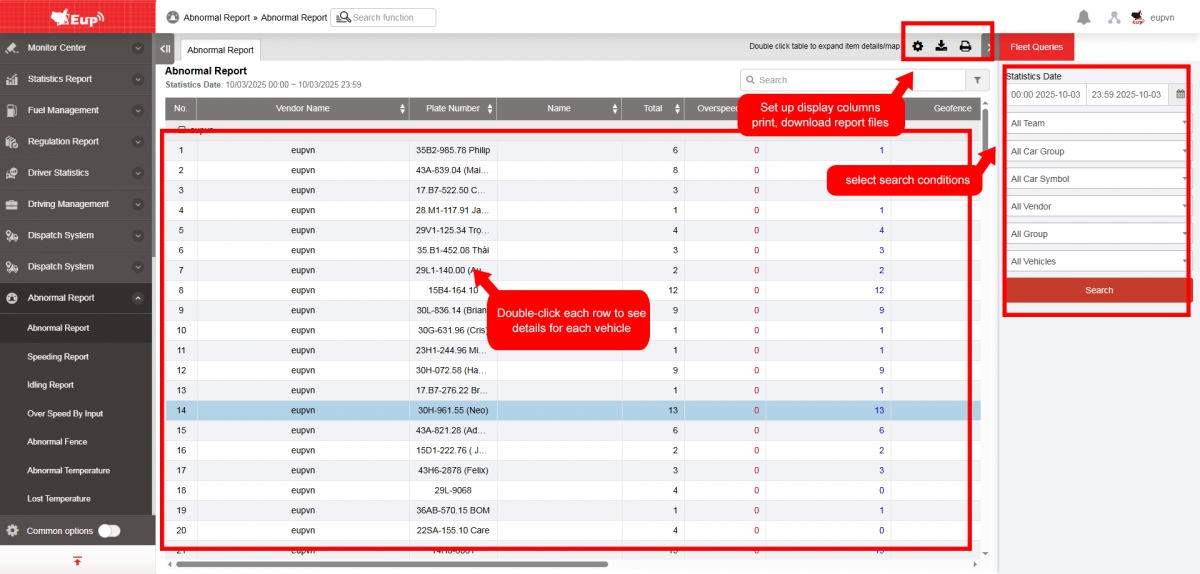
- Go to the Abnormal Report»Abnormal Report.

 - The display function screen consists of 2 parts:
+ Fleet Queries section allows users to set up time parameters and vehicles to view the report;
+ Report details section display the number of violations for each type of violation.
+ Fleet Queries section: the user selects the following information:
-
From: The user enters the first day to create the report;
-
To: The user selects the last day to create the report;
-
Select the icon
 to select the Team;
 -
Click Search button to display the report in the Report Details section.
+ Report details section: Display detailed report information.
-
Plate number;
-
Driver;
-
Total: Total number of violations = Speeding + Idling + Abnormal obstacles + Abnormal temperature;
-
Overspeeding: Count the number of times exceeding the speed limit;
-
Idling (Stopping without turning off the engine): Count the number of times the vehicle stops without turning off the engine (Speeding alerts separated by >=60s are counted as separate instances);
-
Geofence: Count the number of times the vehicle encounters abnormal obstacles;
-
Abnormal temperature: Count the number of times the vehicle has abnormal temperature;
-
Behavior report: Count the number of times the vehicle suddenly accelerates or decelerates;
-
Sharp turn: Count the number of emergency U-turns;
-
Users can click on a row to view detailed information about the time and location of the vehicle's abnormal activity,...

+ Select the icon  to print the report
+ Select the icon  to download the report as excel
+ Select the icon  to Custom Field, Plate number field settings, Print signature settings
- Log in to post comments
- Tiếng Việt
- 繁體中文
Speeding report
1. Purpose
- Allows the user to generate statistics on the total duration and number of speed limit violations by the driver.
2. Implementation conditions
- The user is granted permission for the Speeding report function on the CRM system.
3. Implementation instructions
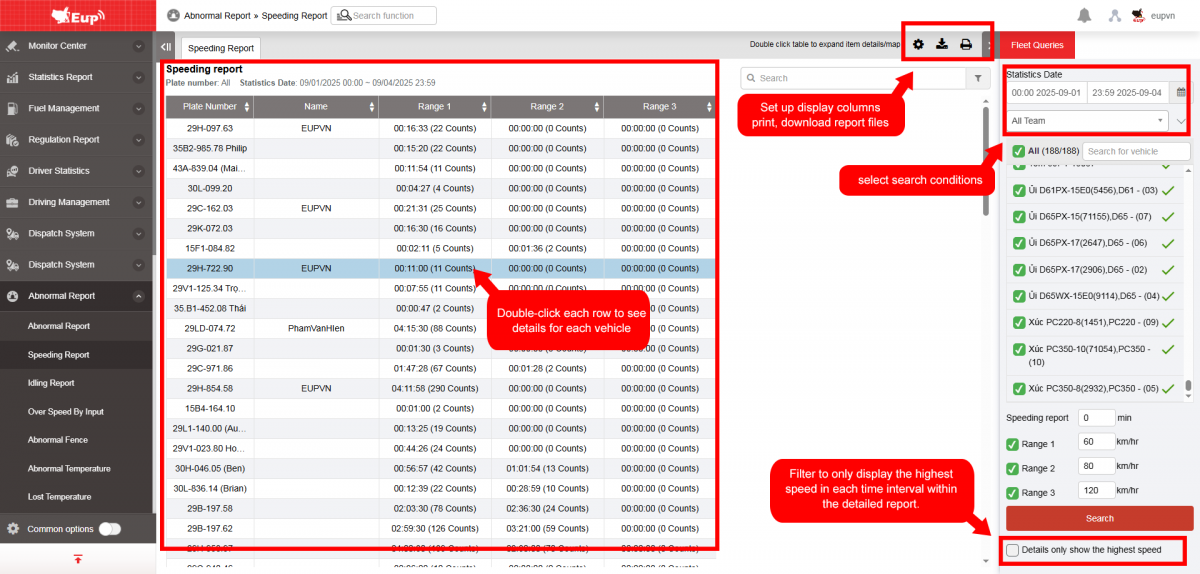
- Go to the Abnormal Report»Speeding report.

- The display function screen consists of 2 parts:
+ Fleet Queries section allows users to set up time parameters and vehicles to view the report.
+ Report details section allows the user to check the duration and number of speed limit violations.
+ Fleet Queries section: the user selects the following information:
-
From: The user enters the first day to create the report;
-
To: The user selects the last day to create the report;
-
Select the icon
to select the Team; -
In the vehicle list: Check the checkbox to select the vehicle to report;
-
Speeding report: The user selects the time of the over-speeding violation, and the Details section will show the number of over-speeding >= selected timeframe.
-
Click Search button to display the report in the Report Details section.
+ Report details section: Display detailed report information.
-
Plate number;
-
Name;
-
Range 1/2/3: Statistical report of the total number of violations and total violation time.
-
The user selects the row they want to view details for and double-clicks to display detailed information on the time and number of violations.

+ Select the icon to print the report
+ Select the icon to download the report as excel
+ Select the icon to Custom Field, Plate number field settings, Print signature settings
- Log in to post comments
- Tiếng Việt
- 繁體中文
Idling report
1. Purpose
- Allows the user to check detailed time and location information for instances when the driver stops the vehicle without turning off the engine within a maximum period of 1 month..
2. Implementation conditions
- The user is granted permission for the Idling report function on the CRM system.
3. Implementation instructions
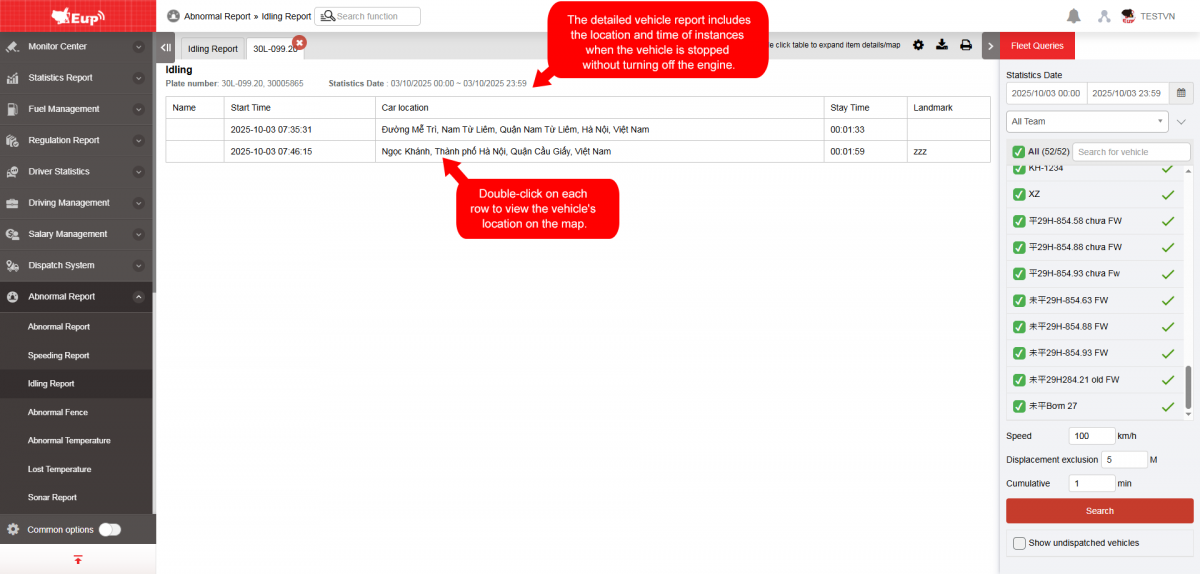
- Go to the Abnormal Report»Idling report.

- The display function screen consists of 2 parts:
+ Fleet Queries section allows users to set up time parameters and vehicles to view the report;
+ Report details section displays the daily driving time of each driver

+ Fleet Queries section: the user selects the following information:
-
From: The user enters the first day to create the report;
-
To: The user selects the last day to create the report;
-
Select the icon
to select the Team; -
In the vehicle list: Check the checkbox to select the vehicle to report;
-
Speed ... km/h: Search for vehicles with a speed <= ... km/h (Vehicles that are moving but have a speed <= ... km/h will still be displayed in the report).
-
Displacement exclusion ... m: Search for vehicles stopped without turning off the engine with a travel distance <= ... m (Vehicles that are moving but have a travel distance <= ... m will still be displayed in the report).
-
Cumulative ... minutes or more: Search for vehicles stopped without turning off the engine for a stop duration >= ... minutes.
-
Show undispatched vehicles: Include vehicles that are not operational in the report.
-
Click Search button to display the report in the Report Details section.
+ Report details section: Display detailed report information.
-
Plate number
-
Name
-
Stop count: Total number of times the vehicle stops without turning off the engine.
-
Total time: Total time the vehicle remains stopped without turning off the engine.
-
The user selects the row to review, double-clicks to display specific details including the address and time of each instance where the vehicle stopped without turning off the engine.
+ Select the icon to print the report
+ Select the icon to download the report as excel
+ Select the icon to Custom Field, Plate number field settings, Print signature settings
- Log in to post comments
- Tiếng Việt
- 繁體中文
Over speed by input
1. Purpose
- Allows users to check the specific time and location where the vehicle overspeeds.
2. Implementation conditions
- The user is granted permission for the Over speed by input function on the CRM system.
3. Implementation instructions
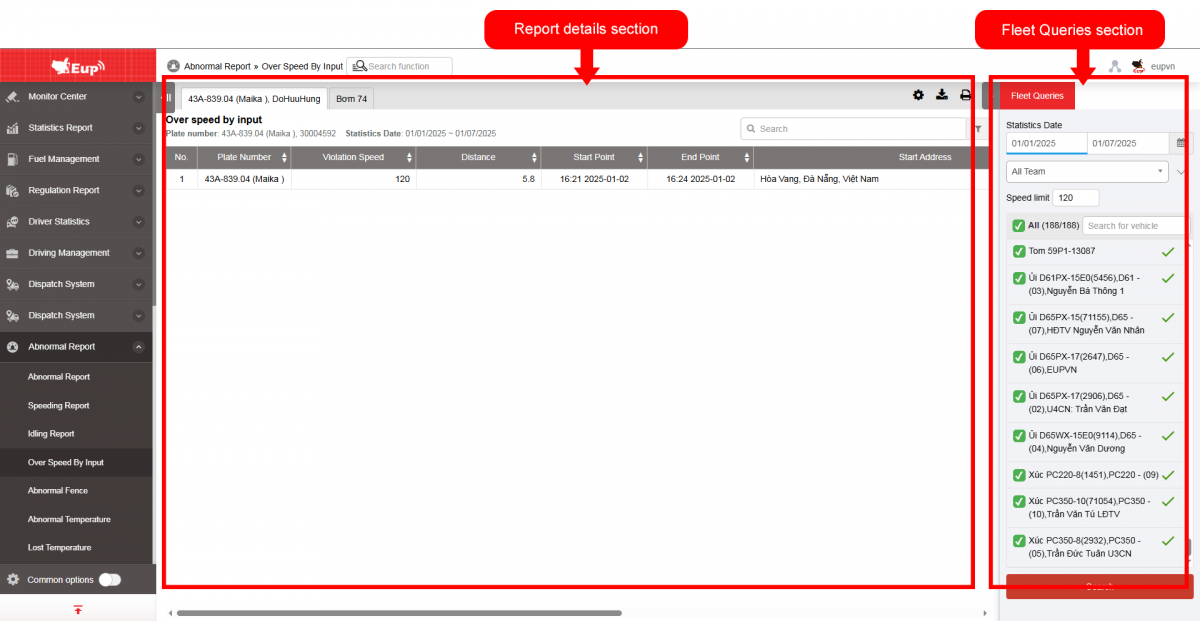
- Go to the Abnormal Report»Over speed by input

- The display function screen consists of 2 parts:
+ Fleet Queries section allows users to set up time parameters and vehicles to view the report;
+ Report details section displays the daily driving time of each driver
+ Fleet Queries section: the user selects the following information:
-
From: The user enters the first day to create the report;
-
To: The user selects the last day to create the report;
-
Select the icon
to select the Team; -
In the vehicle list: Check the checkbox to select the vehicle to report;
-
Speed Limit (default 120): When the vehicle exceeds ... km/h, it will be displayed in the report.
-
Click Search button to display the report in the Report Details section.
+ Report details section: Display detailed report information.
-
Plate number
-
Violation Speed
-
Distance
-
Start point: The moment the vehicle begins exceeding the speed limit
-
End point: The moment the vehicle stops exceeding the speed limit
-
Start Address
-
Start coordinate
-
End Address
-
End coordinate
+ Select the icon to print the report
+ Select the icon to download the report as excel
+ Select the icon to Custom Field, Plate number field settings, Print signature setting
- Log in to post comments
- Tiếng Việt
- 繁體中文
Abnormal fence
1. Purpose
- Allows the user to check the specific time and location where the vehicle encounters abnormal fence..
2. Implementation conditions
- The user is granted permission for the Abnormal Fence function on the CRM system.
3. Implementation instructions
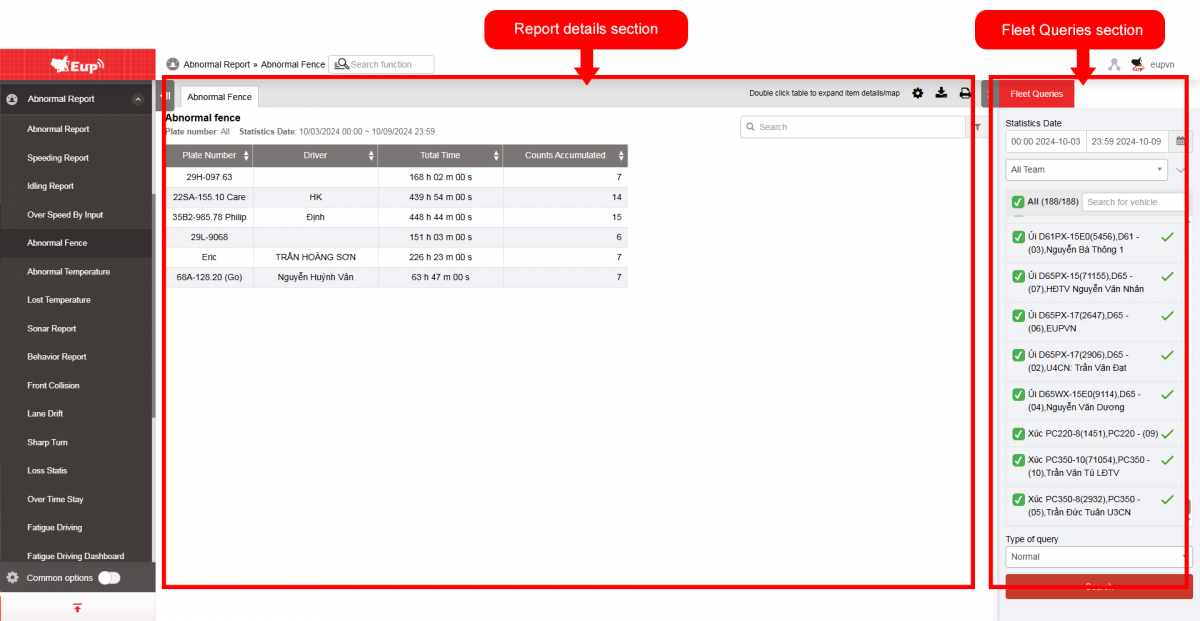
- Go to the Abnormal Report»Abnormal fence.

- The display function screen consists of 2 parts:
+ Fleet Queries section allows users to set up time parameters and vehicles to view the report;
+ Report details section displays the daily driving time of each driver
+ Fleet Queries section: the user selects the following information:
-
From: The user enters the first day to create the report;
-
To: The user selects the last day to create the report;
-
Select the icon
to select the Team; -
In the vehicle list: Check the checkbox to select the vehicle to report;
-
Click Search button to display the report in the Report Details section.
+ Report details section: Display detailed report information.
-
Plate number;
-
Driver;
-
Total time: The total time from when the vehicle encounters the obstacle until it clears the fence.
-
Counts accumulated: Statistics on the total number of times the vehicle encounters fence.
-
The user selects the row to view details, double-clicks to display detailed information including: Obstacle Name, Start Time, End Time, and Total Duration from when the obstacle is encountered until it is cleared.

+ Select the icon to print the report
+ Select the icon to download the report as excel
+ Select the icon to Custom Field, Plate number field settings, Print signature settings

- Log in to post comments
- Tiếng Việt
- 繁體中文
Abnormal temperature
1. Purpose
- Allows the user to check for abnormal vehicle temperature conditions within the search period specified by the user.
2. Implementation conditions
- The user is granted permission for the Abnormal temperature function on the CRM system.
3. Implementation instructions
- Navigate to the Abnormal Report»Abnormal temperatur menu.
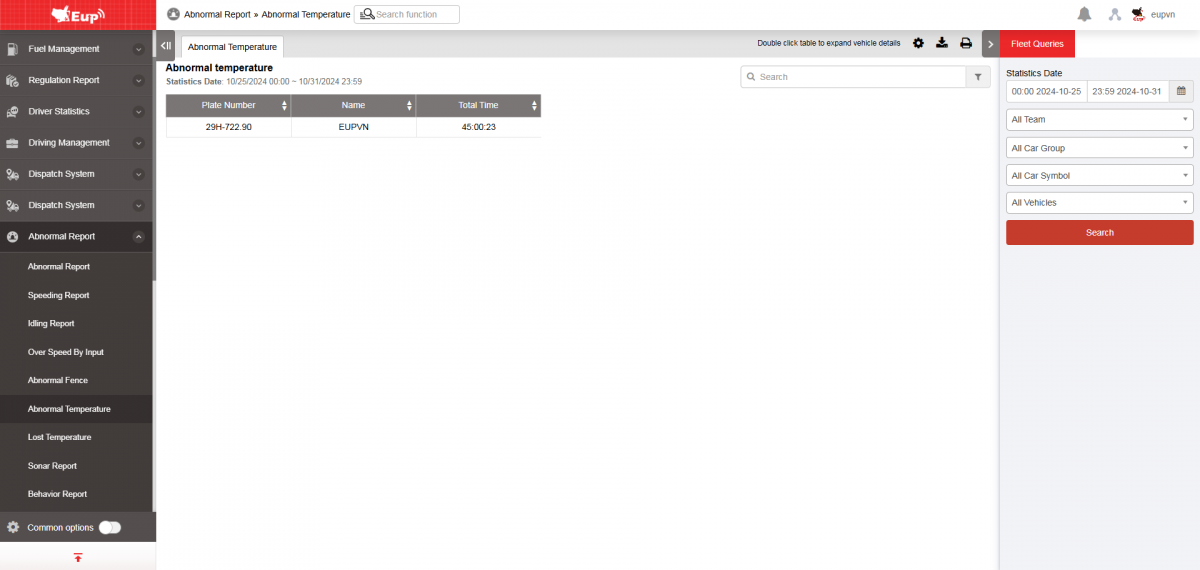
- The display function screen consists of 2 parts:
+ Fleet Queries section allows users to set up time parameters and vehicles to view the report.
+ Report details section display the time and location when the vehicle loses signal.
+ Fleet Queries section: the user selects the following information:
-
From: The user enters the first day to create the report;
-
To: The user selects the last day to create the report;
-
Select the icon
 to select the Team;
 -
In the vehicle list: Check the checkbox to select the vehicle to report;
-
Click Search button to display the report in the Report Details section.
+ Report details section: Display detailed report information.
-
Driver;
-
Plate number;
-
Total time: Total duration of the vehicle's signal loss based on the search period.
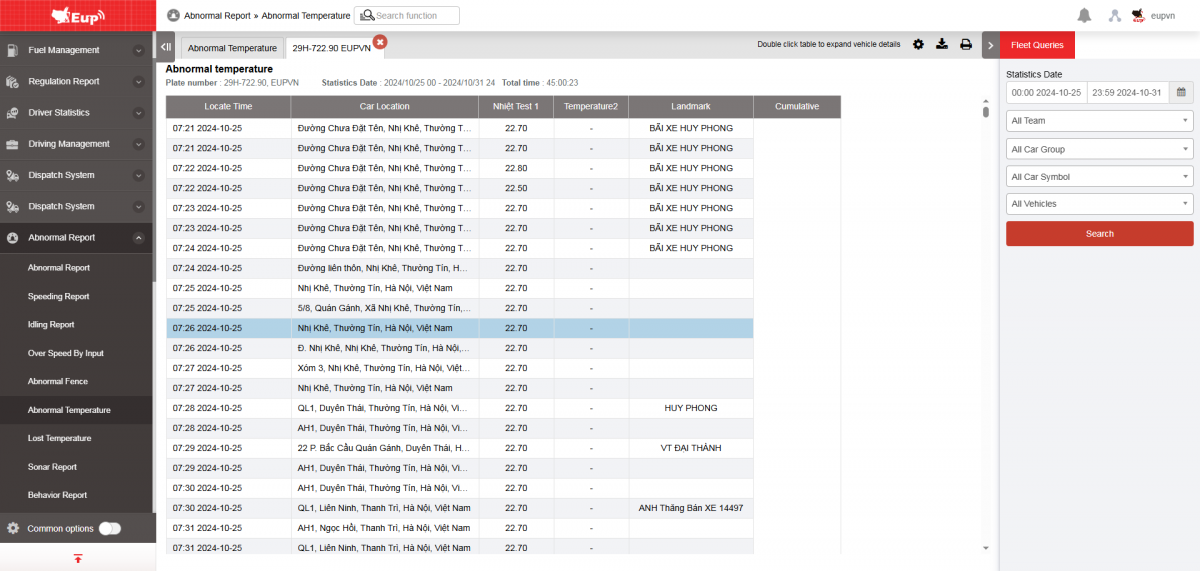
+ The user can select a row and click to view the detailed Abnormal Temperature report for the vehicle. The detailed screen after clicking is as follows
+ Select the icon to print the report
+ Select the icon to download the report as excel
+ Select the icon to Custom Field, Plate number field settings, Print signature settings
- Log in to post comments
- Tiếng Việt
- 繁體中文
Lost Temperature
1. Purpose
- Allows users to install and manage assets and materials of each vehicle.
2. Implementation conditions
- The user is authorized to Los temperature on the CRM system.
3. Implementation instructions
- Go to Abnormal Report menu/ Lost Temperature

The function display screen consists of 2 parts:
+ Fleet queries
+ Detailed report

- Fleet Information section allows the user to select details regarding time, fleet, and vehicles:
-
Entire fleet: By default, the user clicks the icon to select the fleet;
-
All: By default, all vehicles in the fleet are selected; the user can click the icon to choose specific vehicles;
-
From: The starting date the user wants to check;
-
To: The ending date the user wants to check;
-
Search: Click Search to display the results.
- Detailed Information section:
-
License plate
-
Start time: The time when the vehicle lost the temperature signal
-
End time: The time when the vehicle regained the temperature signal
-
Duration: The total time the vehicle lost the temperature signal
-
Start location: The location where the vehicle lost the temperature signal
-
End location: The location where the vehicle regained the temperature signal
-
Action: View the route and vehicle location on the map

- Select the icon
 to print the report;
 - Select the icon
 to download the report as excel;
 - Select the icon
 to set the display or hide or change the sort order of the report columns.
- Log in to post comments
- Tiếng Việt
- 繁體中文
Lái xe mất tập trung
I. Mục đích
- Cho phép NSD quản lý theo dõi bảo dưỡng, sửa chữa xe.
II. Điều kiện thực hiện
- NSD được phân quyền Lái xe mất tập trung trên hệ thống CRM.
III. Hướng dẫn thực hiện
- Vào menu báo cáo bất thường/Lái xe mất tập trung
- Màn hình chức năng hiển thị 2 phần:
Lái xe mất tập trung
I. Mục đích
- Cho phép NSD quản lý theo dõi bảo dưỡng, sửa chữa xe.
II. Điều kiện thực hiện
- NSD được phân quyền Lái xe mất tập trung trên hệ thống CRM.
III. Hướng dẫn thực hiện
- Vào menu báo cáo bất thường/Lái xe mất tập trung
- Màn hình chức năng hiển thị 2 phần:
Lái xe mất tập trung
I. Mục đích
- Cho phép NSD quản lý theo dõi bảo dưỡng, sửa chữa xe.
II. Điều kiện thực hiện
- NSD được phân quyền Lái xe mất tập trung trên hệ thống CRM.
III. Hướng dẫn thực hiện
- Vào menu báo cáo bất thường/Lái xe mất tập trung
- Màn hình chức năng hiển thị 2 phần:
Sonar report
1. Purpose
- Allows users to manage and monitor vehicle maintenance and repair.
2. Implementation conditions
- The user is Sonar report on the CRM system.
3. Implementation instructions
- Go to the abnormal report menu/ Sonar report
- The display function screen consists of 2 parts:
+ Fleet Queries section allows users to set time parameters and vehicles to view reports;
+ Report Details section Show detailed report

Detailed Information:
-
License Plate
-
Start Time: The time when the vehicle lost the temperature signal
-
End Time: The time when the vehicle regained the temperature signal
-
Duration: Total time the vehicle lost the temperature signal
-
Start Location: Location where the vehicle lost the temperature signal
-
End Location: Location where the vehicle regained the temperature signal
-
Action: View route and vehicle location on the map
Detailed Information
-
License Plate
-
Driver
-
Start Time
-
End Time
-
Total
The user double-clicks on a row to view the detailed report:
-
Start Time
-
End Time
-
Vehicle Speed
-
Status
-
Start Coordinates
-
End Coordinates
-
Start Location
-
End Location

- Select the icon
 to print the report;
 - Select the icon
 to download the report as excel;
 - Select the icon
 to set the display or hide or change the sort order of the report columns.
- Log in to post comments
- Tiếng Việt
- 繁體中文
Behavior report
1. Purpose
- Allow the user to configure and manage assets and supplies for each vehicle
2. Implementation conditions
- Users are authorized Behavior report on the CRM system.
3. Implementation instructions
- Go to menu Abnormal Report/ Behavior report

- The function screen displays two sections:
-
Fleet Information section
-
Detailed Information section

- Fleet Information section:
-
Entire fleet: By default, the user clicks the icon to select the fleet;
-
All vehicles in the fleet: Default is all vehicles, the user clicks the icon to select specific vehicles;
-
From: The first date the user wants to check;
-
To: The last date the user wants to check;
-
Search: Click Search to display the results.
- Detailed Information section:
-
License plate number
-
Name
-
Acceleration (HAI)
-
Deceleration (HDI)
The user double-clicks a report row to view detailed information for each vehicle

- Date
- Status
- Vehicle speed
- Start location
- End location
- Select icon to print report
- Select the icon to download the report in excel format
- Select icons to customize display columns, customize license plates on reports and set up printing signatures

- Log in to post comments
- Tiếng Việt
- 繁體中文
Loss Statis
1. Purpose
- Allow the user to check the vehicle’s signal loss status within the searched time range
2. Implementation conditions
- The user is granted permission to access the Loss Statis function in the CRM system
3. Implementation instructions
- Go to menu Abnormal Report/Loss Statis
- The function screen is divided into two sections: The Fleet Information section allows the user to select date, vehicle, and fleet details; the Detailed Information section displays the time and location where the vehicle lost signal.
- Fleet Information section: The user selects the following information:
-
From: The first date the user wants to check;
-
To: The last date the user wants to check;
-
Entire fleet: By default, the user clicks the icon to select the fleet;
-
In the vehicle list, the user can select individual vehicles or all;
-
Click Search to display detailed information
- The Detailed Information section displays the following:
-License plate number;
- Vehicle status:
- GSM disconnection: loss of connection to the device, possibly due to power failure, grounding cut, GPS issues, etc.
- GPS disconnection: loss of GPS signal only.
-
Start time: The time when the vehicle lost signal.
-
End time: The time when the vehicle regained signal.
-
Duration: The total time the vehicle lost signal within the search period.
-
Start location: The place where the vehicle first lost signal.
-
End location: The place where the vehicle regained signal.
- Select icon to print report
- Select the icon to download the report in excel format
- Select icons to customize display columns, customize license plates on reports and set up printing signatures
- The user can click on Trip to view the detailed map
- Log in to post comments
- Tiếng Việt
- 繁體中文
Over Time Stay
1. Purpose
- Support the user in checking detailed time and location of vehicle stops outside the predefined milestones within the searched time range
2. Implementation conditions
- The user is authorized to Over Time Stay on the CRM system.
3. Implementation instructions
- Go to menu Abnormal Report/Over Time Stay

-
The function screen consists of two sections:
-
Fleet queries: allows the user to select date, vehicle and fleet information, and stop/parking duration.
-
Detailed report: displays the time and location where the vehicle stopped/parked outside the milestones

- Fleet queries: The user selects the following information:
-
From: The first date the user wants to check;
-
To: The last date the user wants to check;
-
Entire fleet: By default, the user clicks the icon to select the fleet;
-
In the vehicle list, the user can select individual vehicles or all;
-
Stop/Parking duration: Default is 2 minutes, the user can change it;
-
Click Search to display detailed information.
- Detailed report section displays the following:
-
License plate number;
-
Driver: Driver’s name;
-
Start time: The time when the vehicle stopped/parked outside the milestone;
-
End time: The time when the vehicle started moving away from the stop/park point;
-
Parking duration: The total time the vehicle stopped/parked outside the milestone within the search period;
-
Location: The place where the vehicle started stopping/parking outside the milestone
- Select icon to print report
- Select the icon to download the report in excel format
- Select icons to customize display columns, customize license plates on reports and set up printing signatures
- User can view vehicle location on the map

- Log in to post comments
- Tiếng Việt
- 繁體中文