Trailer analysis report
1. Purpose
- Allows users to check statistical data on the number of trips, usage rate, and trailer operating time in the form of a chart. At the same time, through the chart, users have a visual view of the trailer usage situation.
2. Implementation conditions
- Users are authorized on the CRM system
3. Implementation instructions
- Go to menu Statistics report/Trailer analysis report
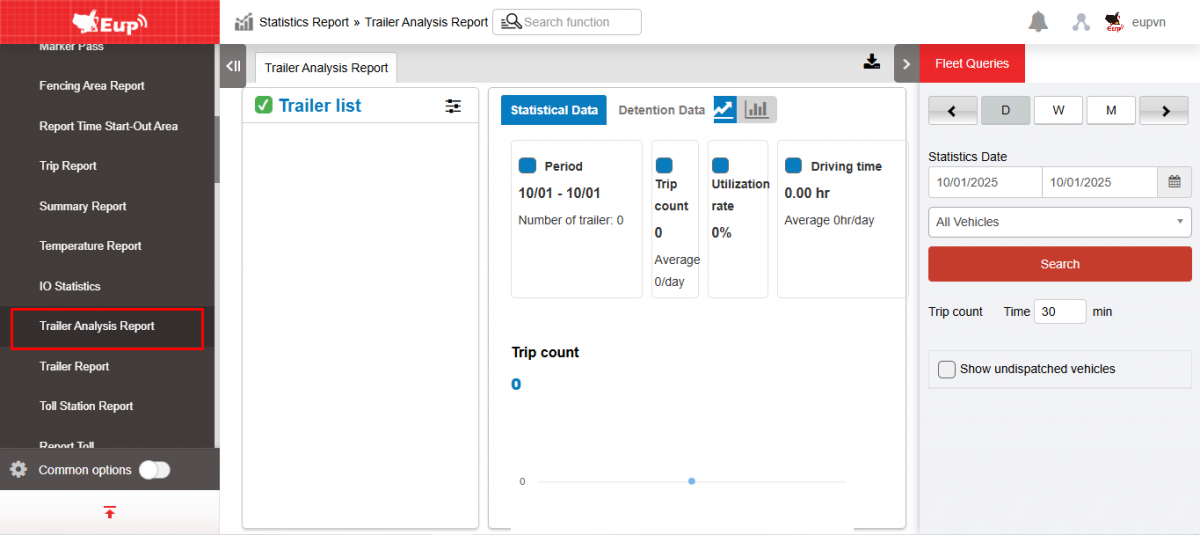
- The function display screen consists of 2 parts:
+ Fleet Queries section allows users to select the vehicle and time they want to view.
+ Trailer analysis report shows the number of trips, usage rate, and trailer operating time in a graph format.
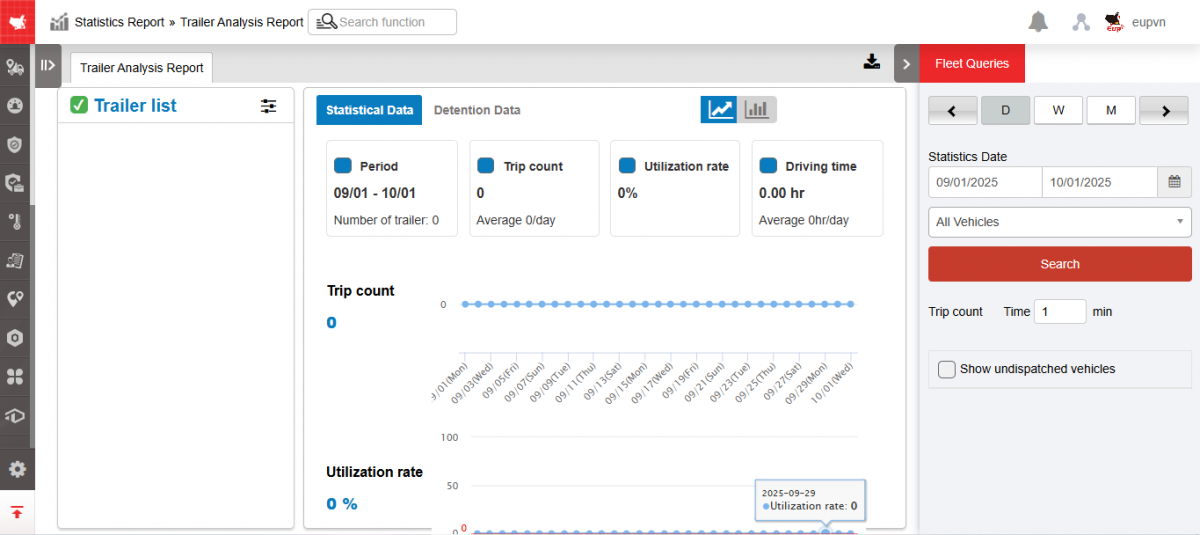
+ Fleet Queries section allows users to select the vehicle and time they need to view:
-
Select view by day/week/month
-
Select report date From...to
-
Choose a car
-
Trip count Time...min
-
Checkbox Show undispatched vehicles
-
Click Search to display results.
+ The report shows the number of trips, usage rate, and trailer operating time in a graph format.
-
Trailers list:
-
Show trailer list.
-
Select the icon
 to select Arrangement: Ascending Order, Descending Order; Options : Descending/Ascending and Select by Trip count, Utilization rate, Driving time
-
-
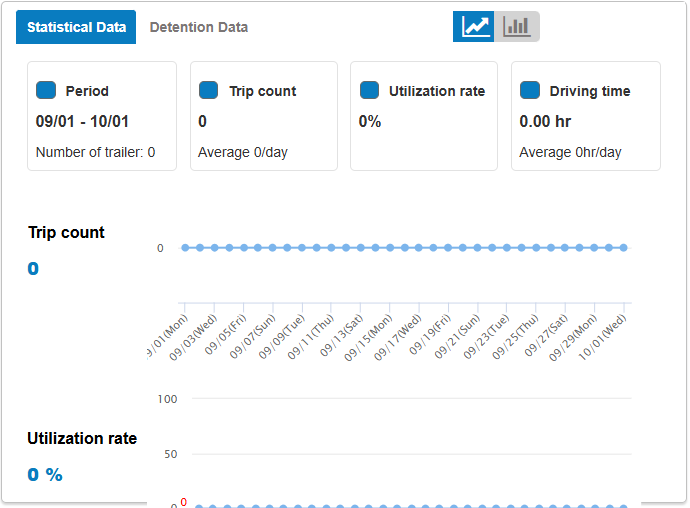
Statistical data: The chart includes information about:
-
Period
-
Trip count
-
Utilization
-
Driving time
-
-
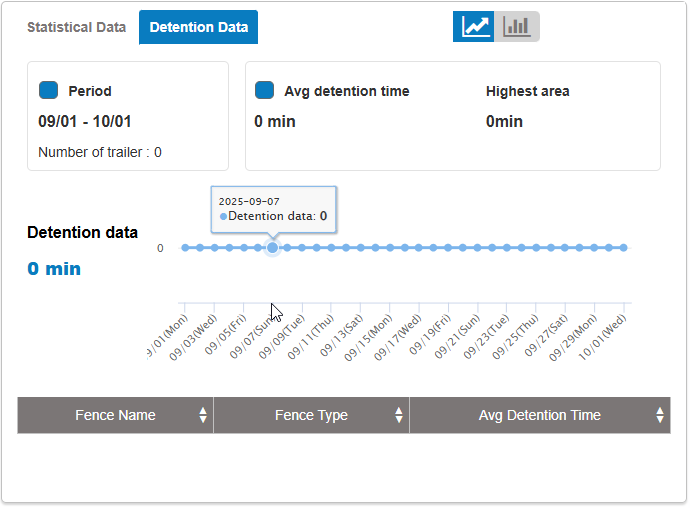
Detention data:
-
Chart: Period, Avg detention time, Highest area
-
Report table: Fence name, Fence type, Avg detention time.
-
-
Select
 to select the chart type
+ Select the icon  to download the report as excel/image
- Log in to post comments
- Tiếng Việt
- 繁體中文