Temperature report
1. Purpose
- Allows users to quickly check the time when the vehicle has an abnormal temperature. At the same time, through the temperature graph, users have an intuitive view of the temperature change situation in the vehicle, thereby assessing the compliance with the temperature according to the pre-set standard threshold of each vehicle.
2. Implementation conditions
- Users are authorized on the CRM system
3. Implementation instructions
- Go to menu Statistics report/Temperature report
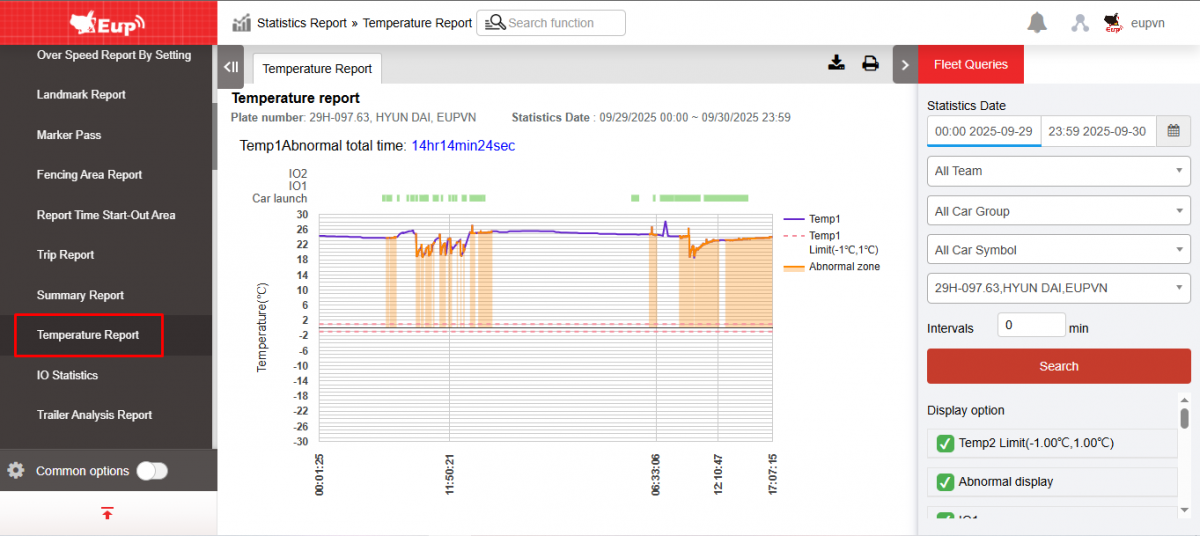
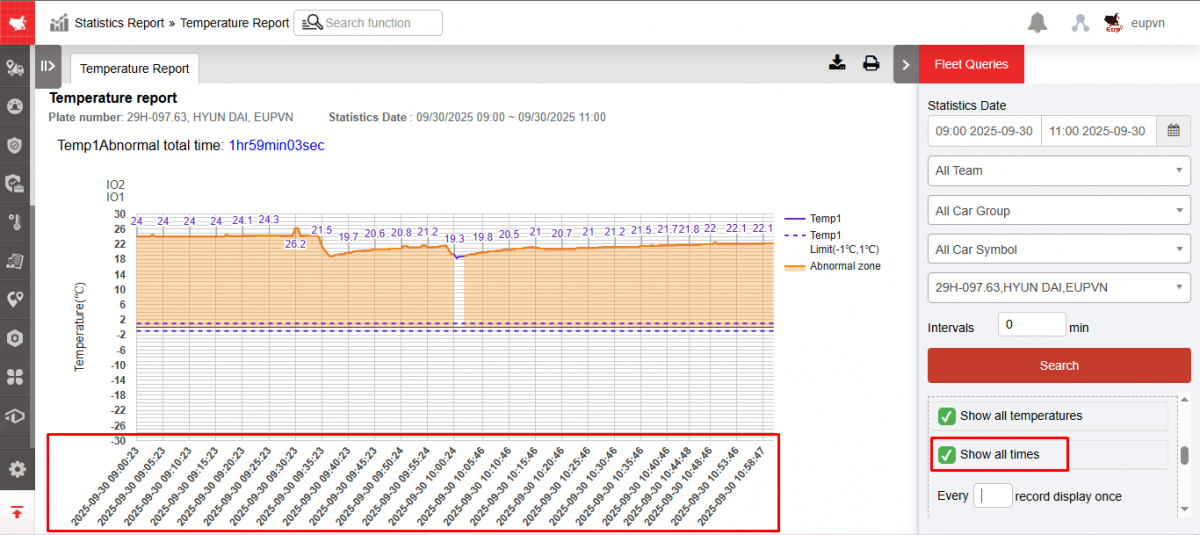
- The function display screen consists of 2 parts:
+ Fleet Queries section allows users to select vehicles and the time they need to view the temperature graph;
+ The Temperature report section displays a summary of the total time the vehicle had an abnormal temperature and a temperature graph of the vehicle
+ Fleet Queries section : Includes the following information
-
From : Allows users to select the first date and time they want to view the graph.
-
To : Allows users to select the last date and time they want to view the graph.
-
Fleet : Default is entire fleet and allows to select individual fleets
-
Vehicle : Default is any vehicle in the fleet and the user selects
 to select the vehicle to view the graph
 -
Display option:
-
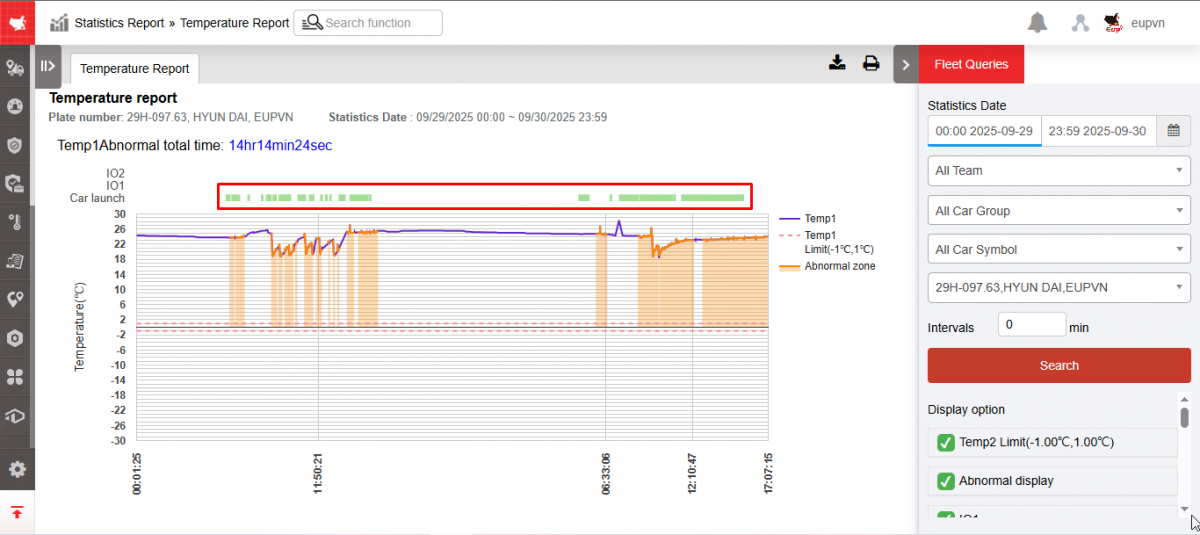
IO1/IO2 Name: Displays the IO1 and IO2 names set at the IO Temperature tab of the Settings/Basic Information page respectively (Example image: IO1 and 2 names are set as Switch to 1 and Switch to 2)
-
Vehicle Start: Check to enable display of green line
-
-
Horizontal divider : Displays horizontal divider

-
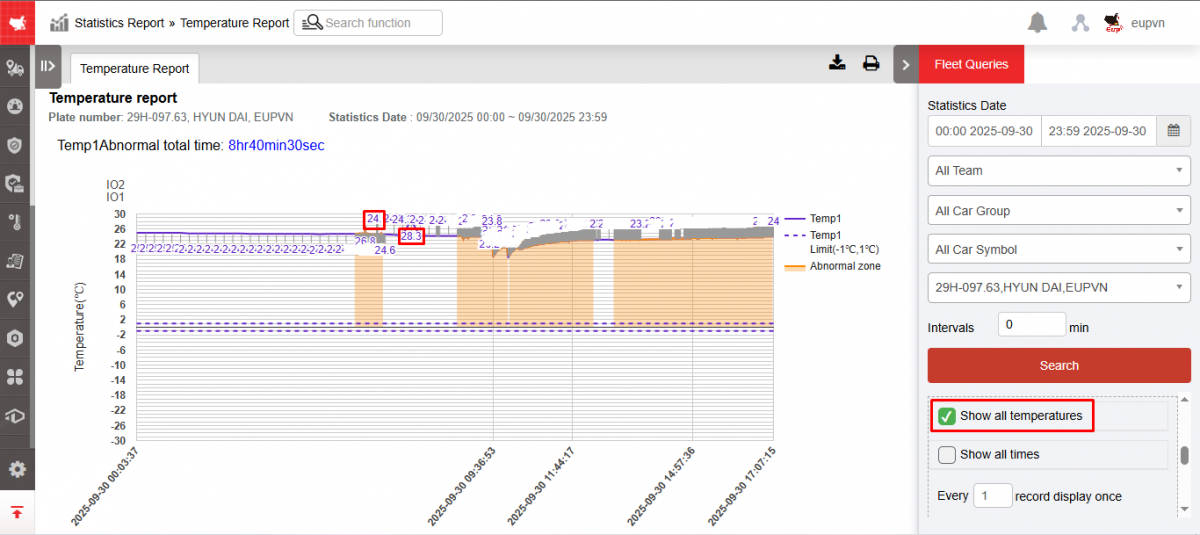
Show all temperatures: Check to show specific temperatures on the graph
-
Show all times: Select to display specific time on the graph. User can choose the time interval to display by changing the number of "pen" in the Display each pen section with 1 pen corresponding to 30
-
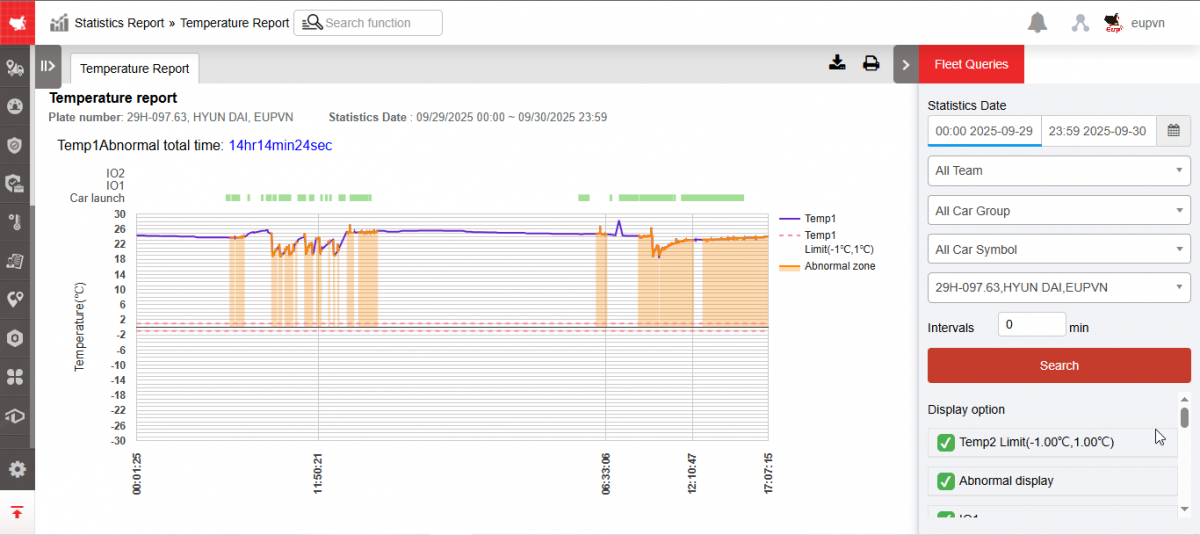
Temp upper/lower limit: The standard temperature threshold has been preset in the Settings/General Information/Temperature & IO function . Only when the vehicle temperature is within this temperature range is the vehicle considered to have a normal temperature.
-
Click Search to display the graph results.
+ The Temperature Graph section includes the following information:
-
The query interval description line
-
Graphical section
+ Select the icon  to print the report
+ Select the icon  to download the report in excel format
- Log in to post comments
- Tiếng Việt
- 繁體中文